29
/pt/
pt
AIzaSyAYiBZKx7MnpbEhh9jyipgxe19OcubqV5w
April 1, 2024
171432
Kuwait
KWT
true
2
1
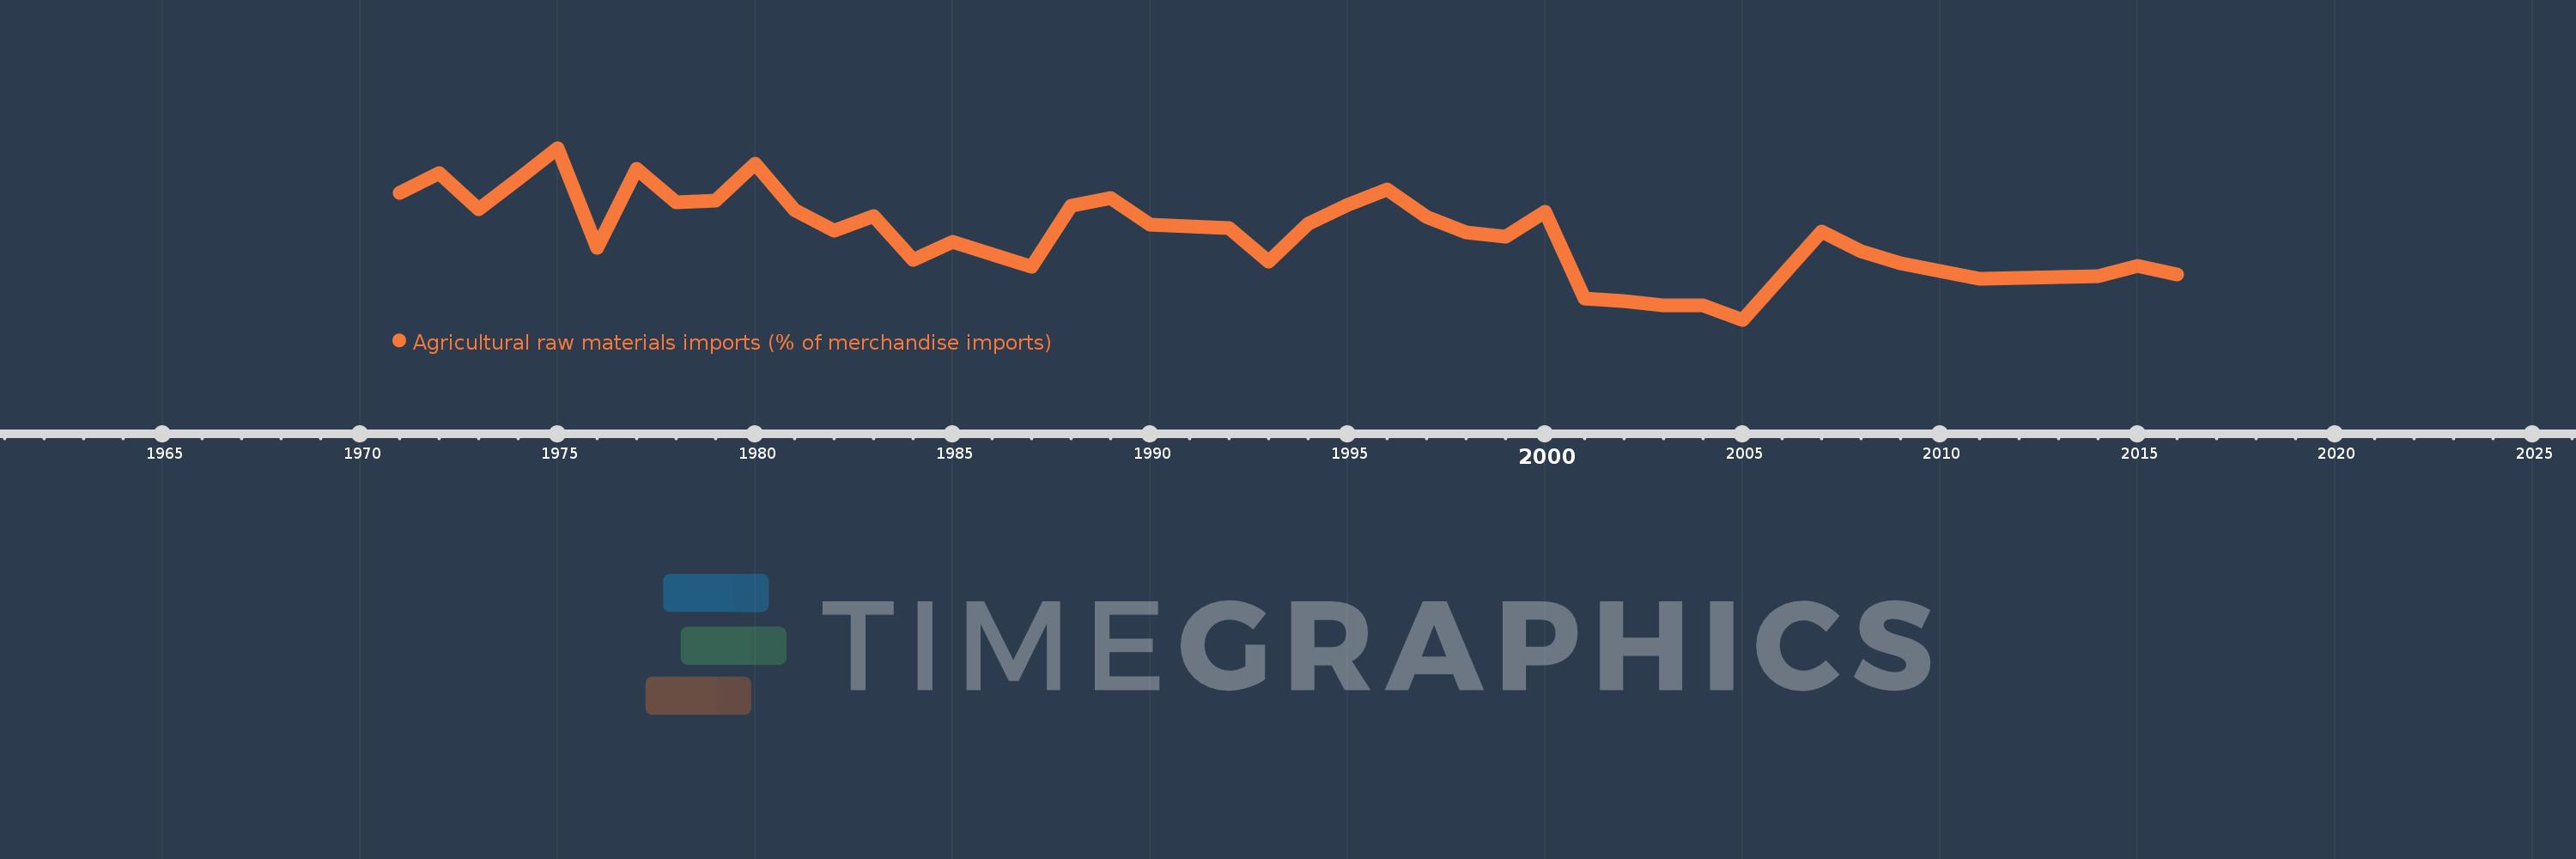
Agricultural raw materials imports (% of merchandise imports)
2016,2015,2014,2011,2009,2008,2007,2005,2004,2003,2002,2001,2000,1999,1998,1997,1996,1995,1994,1993,1992,1991,1990,1989,1988,1987,1985,1984,1983,1982,1981,1980,1979,1978,1977,1976,1975,1974,1973,1972,1971
Estas estatísticas em outros países:
AfghanistanAlbaniaAlgeriaAndorraAngolaAntigua and BarbudaArab WorldArgentinaArmeniaArubaAustraliaAustriaAzerbaijanBahamas, TheBahrainBangladeshBarbadosBelarusBelgiumBelizeBeninBermudaBhutanBoliviaBosnia and HerzegovinaBotswanaBrazilBrunei DarussalamBulgariaBurkina FasoBurundiCabo VerdeCambodiaCameroonCanadaCaribbean small statesCayman IslandsCentral African RepublicCentral Europe and the BalticsChadChileChinaColombiaComorosCongo, Dem. Rep.Congo, Rep.Costa RicaCote d'IvoireCroatiaCubaCyprusCzech RepublicDenmarkDjiboutiDominicaDominican RepublicEarly-demographic dividendEast Asia & PacificEast Asia & Pacific (excluding high income)East Asia & Pacific (IDA & IBRD countries)EcuadorEgypt, Arab Rep.El SalvadorEquatorial GuineaEritreaEstoniaEthiopiaEuro areaEurope & Central AsiaEurope & Central Asia (excluding high income)Europe & Central Asia (IDA & IBRD countries)European UnionFaroe IslandsFijiFinlandFragile and conflict affected situationsFranceFrench PolynesiaGabonGambia, TheGeorgiaGermanyGhanaGreeceGreenlandGrenadaGuatemalaGuineaGuinea-BissauGuyanaHaitiHeavily indebted poor countries (HIPC)High incomeHondurasHong Kong SAR, ChinaHungaryIBRD onlyIcelandIDA & IBRD totalIDA blendIDA onlyIDA totalIndiaIndonesiaIran, Islamic Rep.IraqIrelandIsraelItalyJamaicaJapanJordanKazakhstanKenyaKiribatiKorea, Rep.KuwaitKyrgyz RepublicLao PDRLate-demographic dividendLatin America & Caribbean Latin America & Caribbean (excluding high income)Latin America & the Caribbean (IDA & IBRD countries)LatviaLeast developed countries: UN classificationLebanonLesothoLiberiaLibyaLithuaniaLow & middle incomeLow incomeLower middle incomeLuxembourgMacao SAR, ChinaMacedonia, FYRMadagascarMalawiMalaysiaMaldivesMaliMaltaMauritaniaMauritiusMexicoMiddle East & North AfricaMiddle East & North Africa (excluding high income)Middle East & North Africa (IDA & IBRD countries)Middle incomeMoldovaMongoliaMoroccoMozambiqueMyanmarNamibiaNepalNetherlandsNew CaledoniaNew ZealandNicaraguaNigerNigeriaNorth AmericaNorwayOECD membersOmanOther small statesPacific island small statesPakistanPalauPanamaPapua New GuineaParaguayPeruPhilippinesPolandPortugalPost-demographic dividendPre-demographic dividendQatarRomaniaRussian FederationRwandaSamoaSao Tome and PrincipeSaudi ArabiaSenegalSerbiaSeychellesSierra LeoneSingaporeSlovak RepublicSloveniaSmall statesSolomon IslandsSomaliaSouth AfricaSouth AsiaSouth Asia (IDA & IBRD)SpainSri LankaSt. Kitts and NevisSt. LuciaSt. Vincent and the GrenadinesSub-Saharan Africa Sub-Saharan Africa (excluding high income)Sub-Saharan Africa (IDA & IBRD countries)SudanSurinameSwazilandSwedenSwitzerlandSyrian Arab RepublicTajikistanTanzaniaThailandTimor-LesteTogoTongaTrinidad and TobagoTunisiaTurkeyTurkmenistanTurks and Caicos IslandsTuvaluUgandaUkraineUnited Arab EmiratesUnited KingdomUnited StatesUpper middle incomeUruguayVanuatuVenezuela, RBVietnamVirgin Islands (U.S.)WorldYemen, Rep.ZambiaZimbabwe Linha do tempo:
Nesta escala de tempo está apresentado um gráfico de 1971 ano até 2016 ano Kuwait. Dados de 1970 ano ausente. O número de observações reais por data: 41.
Fonte (nome):
Indicadores de desenvolvimento mundial
Fonte (organização):
World Bank staff estimates from the Comtrade database maintained by the United Nations Statistics Division.
Categorias:
Agriculture & Rural Development, Private Sector, Trade
Foi atualizado:
23 abr 2017 ano
Indicadores de alterações dos valores ao longo dos anos
Mínimo:
0.255
1 jan 2005 ano
Máximo:
1.377
1 jan 1975 ano
Na data de observação
Valor
Mudança absoluta
A alteração em relação ao valor anterior
1 jan 1971 ano
1.085
+1.085
0.0%
1 jan 1972 ano
1.215
+0.129
11.92%
1 jan 1973 ano
0.979
-0.236
-19.4%
1 jan 1974 ano
1.172
+0.192
19.66%
1 jan 1975 ano
1.377
+0.205
17.53%
1 jan 1976 ano
0.725
-0.652
-47.32%
1 jan 1977 ano
1.242
+0.517
71.31%
1 jan 1978 ano
1.024
-0.218
-17.55%
1 jan 1979 ano
1.032
+0.007
0.7%
1 jan 1980 ano
1.274
+0.242
23.5%
1 jan 1981 ano
0.97
-0.303
-23.82%
1 jan 1982 ano
0.836
-0.134
-13.85%
1 jan 1983 ano
0.931
+0.095
11.35%
1 jan 1984 ano
0.647
-0.284
-30.52%
1 jan 1985 ano
0.762
+0.116
17.89%
1 jan 1987 ano
0.601
-0.161
-21.17%
1 jan 1988 ano
0.999
+0.398
66.24%
1 jan 1989 ano
1.05
+0.051
5.08%
1 jan 1990 ano
0.877
-0.173
-16.47%
1 jan 1991 ano
0.863
-0.014
-1.58%
1 jan 1992 ano
0.854
-0.01
-1.11%
1 jan 1993 ano
0.632
-0.221
-25.91%
1 jan 1994 ano
0.883
+0.251
39.68%
1 jan 1995 ano
1.005
+0.122
13.78%
1 jan 1996 ano
1.106
+0.101
10.06%
1 jan 1997 ano
0.929
-0.178
-16.06%
1 jan 1998 ano
0.828
-0.101
-10.88%
1 jan 1999 ano
0.798
-0.03
-3.57%
1 jan 2000 ano
0.962
+0.164
20.57%
1 jan 2001 ano
0.395
-0.568
-58.99%
1 jan 2002 ano
0.379
-0.016
-3.95%
1 jan 2003 ano
0.351
-0.028
-7.29%
1 jan 2004 ano
0.346
-0.006
-1.62%
1 jan 2005 ano
0.255
-0.091
-26.32%
1 jan 2007 ano
0.83
+0.575
225.86%
1 jan 2008 ano
0.701
-0.129
-15.59%
1 jan 2009 ano
0.626
-0.074
-10.58%
1 jan 2011 ano
0.523
-0.104
-16.57%
1 jan 2014 ano
0.538
+0.015
2.88%
1 jan 2015 ano
0.609
+0.071
13.22%
1 jan 2016 ano
0.548
-0.061
-9.94%
Classificação de países por estatísticas atuais por anos


Comentários: