29
/pt/
pt
AIzaSyAYiBZKx7MnpbEhh9jyipgxe19OcubqV5w
April 1, 2024
214368
Norway
NOR
true
2
1
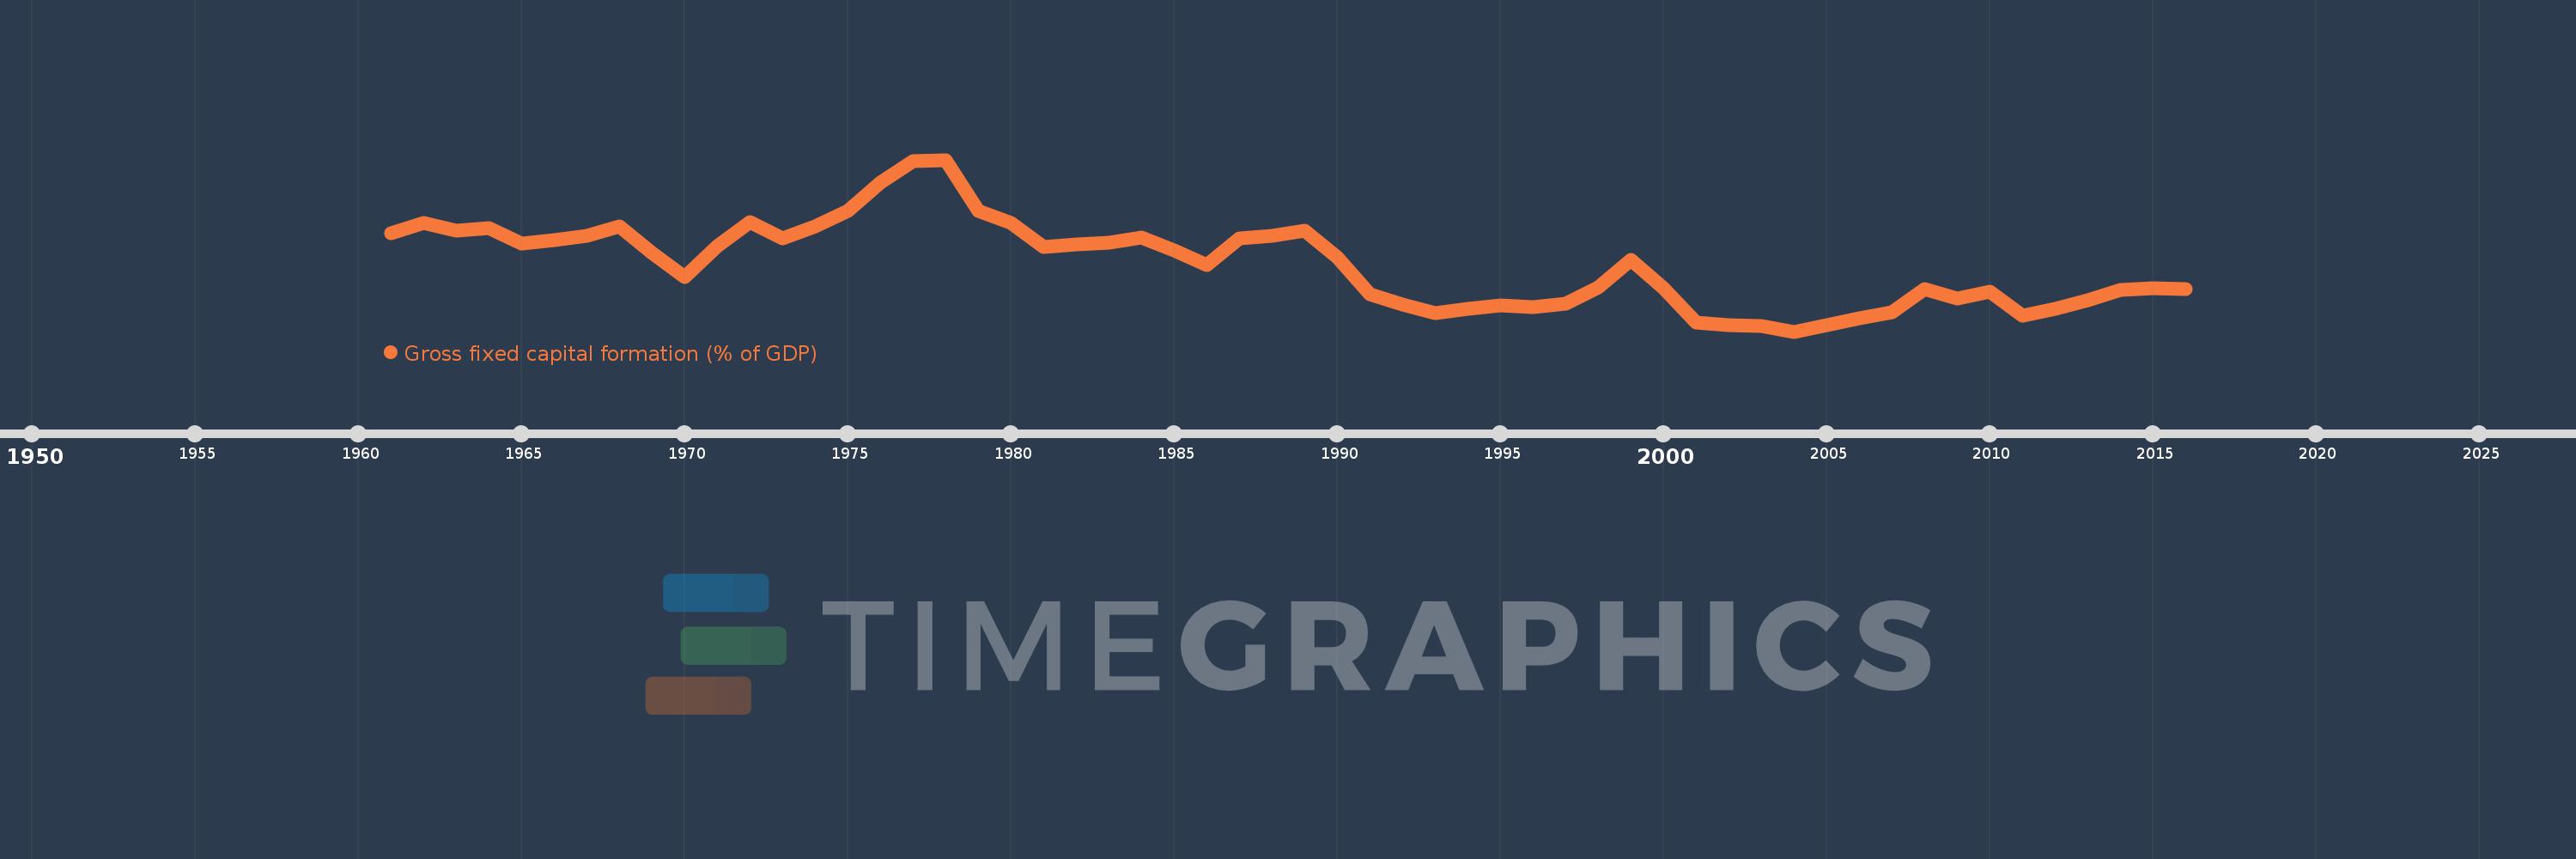
Gross fixed capital formation (% of GDP)
2016,2015,2014,2013,2012,2011,2010,2009,2008,2007,2006,2005,2004,2003,2002,2001,2000,1999,1998,1997,1996,1995,1994,1993,1992,1991,1990,1989,1988,1987,1986,1985,1984,1983,1982,1981,1980,1979,1978,1977,1976,1975,1974,1973,1972,1971,1970,1969,1968,1967,1966,1965,1964,1963,1962,1961
Estas estatísticas em outros países:
AfghanistanAlbaniaAlgeriaAngolaAntigua and BarbudaArab WorldArgentinaArmeniaArubaAustraliaAustriaAzerbaijanBahamas, TheBahrainBangladeshBarbadosBelarusBelgiumBelizeBeninBermudaBhutanBoliviaBosnia and HerzegovinaBotswanaBrazilBrunei DarussalamBulgariaBurkina FasoBurundiCabo VerdeCambodiaCameroonCanadaCaribbean small statesCentral African RepublicCentral Europe and the BalticsChadChileChinaColombiaComorosCongo, Dem. Rep.Congo, Rep.Costa RicaCote d'IvoireCroatiaCubaCyprusCzech RepublicDenmarkDjiboutiDominicaDominican RepublicEarly-demographic dividendEast Asia & PacificEast Asia & Pacific (excluding high income)East Asia & Pacific (IDA & IBRD countries)EcuadorEgypt, Arab Rep.El SalvadorEquatorial GuineaEritreaEstoniaEthiopiaEuro areaEurope & Central AsiaEurope & Central Asia (excluding high income)Europe & Central Asia (IDA & IBRD countries)European UnionFijiFinlandFragile and conflict affected situationsFranceGabonGambia, TheGeorgiaGermanyGhanaGreeceGrenadaGuatemalaGuineaGuinea-BissauGuyanaHaitiHeavily indebted poor countries (HIPC)High incomeHondurasHong Kong SAR, ChinaHungaryIBRD onlyIcelandIDA & IBRD totalIDA blendIDA onlyIDA totalIndiaIndonesiaIran, Islamic Rep.IraqIrelandIsraelItalyJamaicaJapanJordanKazakhstanKenyaKiribatiKorea, Rep.KosovoKuwaitKyrgyz RepublicLao PDRLate-demographic dividendLatin America & Caribbean Latin America & Caribbean (excluding high income)Latin America & the Caribbean (IDA & IBRD countries)LatviaLeast developed countries: UN classificationLebanonLesothoLiberiaLibyaLithuaniaLow & middle incomeLow incomeLower middle incomeLuxembourgMacao SAR, ChinaMacedonia, FYRMadagascarMalawiMalaysiaMaldivesMaliMaltaMauritaniaMauritiusMexicoMicronesia, Fed. Sts.Middle East & North AfricaMiddle East & North Africa (excluding high income)Middle East & North Africa (IDA & IBRD countries)Middle incomeMoldovaMongoliaMontenegroMoroccoMozambiqueNamibiaNepalNetherlandsNew CaledoniaNew ZealandNicaraguaNigerNigeriaNorth AmericaNorwayOECD membersOmanPacific island small statesPakistanPanamaPapua New GuineaParaguayPeruPhilippinesPolandPortugalPost-demographic dividendPre-demographic dividendPuerto RicoRomaniaRussian FederationRwandaSaudi ArabiaSenegalSerbiaSeychellesSierra LeoneSingaporeSlovak RepublicSloveniaSolomon IslandsSomaliaSouth AfricaSouth AsiaSouth Asia (IDA & IBRD)South SudanSpainSri LankaSt. Kitts and NevisSt. LuciaSt. Vincent and the GrenadinesSub-Saharan Africa Sub-Saharan Africa (excluding high income)Sub-Saharan Africa (IDA & IBRD countries)SudanSurinameSwazilandSwedenSwitzerlandSyrian Arab RepublicTajikistanTanzaniaThailandTimor-LesteTogoTongaTrinidad and TobagoTunisiaTurkeyTurkmenistanUgandaUkraineUnited Arab EmiratesUnited KingdomUnited StatesUpper middle incomeUruguayUzbekistanVanuatuVenezuela, RBVietnamWest Bank and GazaWorldYemen, Rep.ZambiaZimbabwe Linha do tempo:
Nesta escala de tempo está apresentado um gráfico de 1961 ano até 2016 ano Norway. Dados de 1960 ano ausente. O número de observações reais por data: 56.
Fonte (nome):
Indicadores de desenvolvimento mundial
Fonte (organização):
World Bank national accounts data, and OECD National Accounts data files.
Categorias:
Economy & Growth
Foi atualizado:
23 abr 2017 ano
Indicadores de alterações dos valores ao longo dos anos
Mínimo:
18.868
1 jan 2004 ano
Máximo:
37.22
1 jan 1978 ano
Na data de observação
Valor
Mudança absoluta
A alteração em relação ao valor anterior
1 jan 1961 ano
29.415
+29.415
0.0%
1 jan 1962 ano
30.48
+1.065
3.62%
1 jan 1963 ano
29.636
-0.844
-2.77%
1 jan 1964 ano
29.965
+0.329
1.11%
1 jan 1965 ano
28.319
-1.646
-5.49%
1 jan 1966 ano
28.677
+0.358
1.26%
1 jan 1967 ano
29.103
+0.426
1.49%
1 jan 1968 ano
30.121
+1.019
3.5%
1 jan 1969 ano
27.282
-2.839
-9.43%
1 jan 1970 ano
24.681
-2.602
-9.54%
1 jan 1971 ano
27.986
+3.306
13.39%
1 jan 1972 ano
30.569
+2.583
9.23%
1 jan 1973 ano
28.858
-1.711
-5.6%
1 jan 1974 ano
30.064
+1.205
4.18%
1 jan 1975 ano
31.794
+1.731
5.76%
1 jan 1976 ano
34.758
+2.964
9.32%
1 jan 1977 ano
37.09
+2.332
6.71%
1 jan 1978 ano
37.22
+0.13
0.35%
1 jan 1979 ano
31.779
-5.441
-14.62%
1 jan 1980 ano
30.487
-1.292
-4.06%
1 jan 1981 ano
27.896
-2.591
-8.5%
1 jan 1982 ano
28.171
+0.275
0.99%
1 jan 1983 ano
28.333
+0.162
0.57%
1 jan 1984 ano
28.897
+0.564
1.99%
1 jan 1985 ano
27.519
-1.378
-4.77%
1 jan 1986 ano
25.982
-1.537
-5.59%
1 jan 1987 ano
28.809
+2.828
10.88%
1 jan 1988 ano
29.121
+0.312
1.08%
1 jan 1989 ano
29.676
+0.555
1.91%
1 jan 1990 ano
26.851
-2.824
-9.52%
1 jan 1991 ano
22.835
-4.016
-14.96%
1 jan 1992 ano
21.75
-1.085
-4.75%
1 jan 1993 ano
20.877
-0.872
-4.01%
1 jan 1994 ano
21.301
+0.424
2.03%
1 jan 1995 ano
21.625
+0.324
1.52%
1 jan 1996 ano
21.439
-0.185
-0.86%
1 jan 1997 ano
21.823
+0.383
1.79%
1 jan 1998 ano
23.551
+1.729
7.92%
1 jan 1999 ano
26.515
+2.964
12.58%
1 jan 2000 ano
23.466
-3.049
-11.5%
1 jan 2001 ano
19.816
-3.65
-15.56%
1 jan 2002 ano
19.525
-0.29
-1.47%
1 jan 2003 ano
19.438
-0.087
-0.45%
1 jan 2004 ano
18.868
-0.57
-2.93%
1 jan 2005 ano
19.598
+0.73
3.87%
1 jan 2006 ano
20.335
+0.737
3.76%
1 jan 2007 ano
20.927
+0.592
2.91%
1 jan 2008 ano
23.446
+2.519
12.04%
1 jan 2009 ano
22.438
-1.007
-4.3%
1 jan 2010 ano
23.106
+0.667
2.97%
1 jan 2011 ano
20.58
-2.525
-10.93%
1 jan 2012 ano
21.316
+0.736
3.58%
1 jan 2013 ano
22.241
+0.924
4.34%
1 jan 2014 ano
23.351
+1.11
4.99%
1 jan 2015 ano
23.541
+0.19
0.81%
1 jan 2016 ano
23.404
-0.137
-0.58%
Classificação de países por estatísticas atuais por anos


Comentários: