29
/pt/
pt
AIzaSyAYiBZKx7MnpbEhh9jyipgxe19OcubqV5w
April 1, 2024
126237
El Salvador
SLV
true
2
1
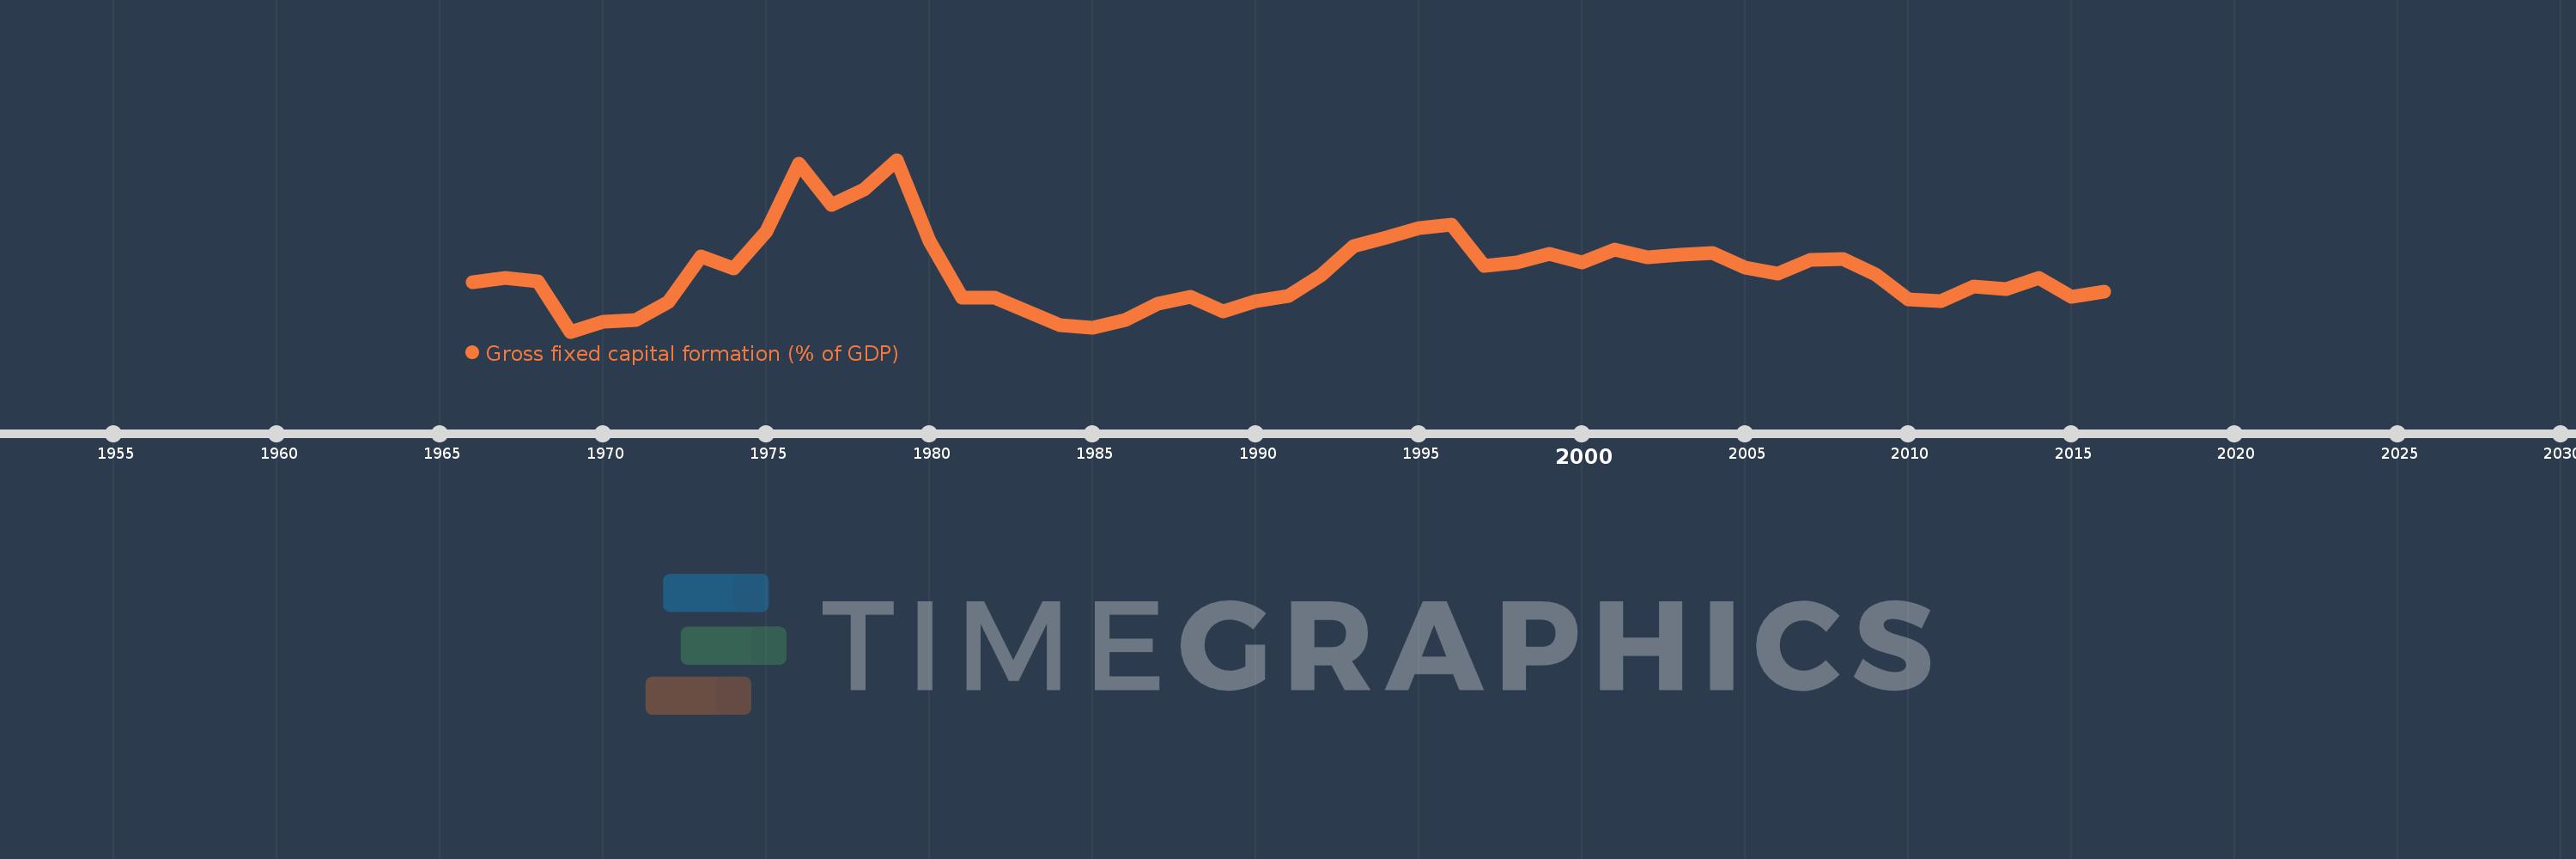
Gross fixed capital formation (% of GDP)
2016,2015,2014,2013,2012,2011,2010,2009,2008,2007,2006,2005,2004,2003,2002,2001,2000,1999,1998,1997,1996,1995,1994,1993,1992,1991,1990,1989,1988,1987,1986,1985,1984,1983,1982,1981,1980,1979,1978,1977,1976,1975,1974,1973,1972,1971,1970,1969,1968,1967,1966
Estas estatísticas em outros países:
AfghanistanAlbaniaAlgeriaAngolaAntigua and BarbudaArab WorldArgentinaArmeniaArubaAustraliaAustriaAzerbaijanBahamas, TheBahrainBangladeshBarbadosBelarusBelgiumBelizeBeninBermudaBhutanBoliviaBosnia and HerzegovinaBotswanaBrazilBrunei DarussalamBulgariaBurkina FasoBurundiCabo VerdeCambodiaCameroonCanadaCaribbean small statesCentral African RepublicCentral Europe and the BalticsChadChileChinaColombiaComorosCongo, Dem. Rep.Congo, Rep.Costa RicaCote d'IvoireCroatiaCubaCyprusCzech RepublicDenmarkDjiboutiDominicaDominican RepublicEarly-demographic dividendEast Asia & PacificEast Asia & Pacific (excluding high income)East Asia & Pacific (IDA & IBRD countries)EcuadorEgypt, Arab Rep.El SalvadorEquatorial GuineaEritreaEstoniaEthiopiaEuro areaEurope & Central AsiaEurope & Central Asia (excluding high income)Europe & Central Asia (IDA & IBRD countries)European UnionFijiFinlandFragile and conflict affected situationsFranceGabonGambia, TheGeorgiaGermanyGhanaGreeceGrenadaGuatemalaGuineaGuinea-BissauGuyanaHaitiHeavily indebted poor countries (HIPC)High incomeHondurasHong Kong SAR, ChinaHungaryIBRD onlyIcelandIDA & IBRD totalIDA blendIDA onlyIDA totalIndiaIndonesiaIran, Islamic Rep.IraqIrelandIsraelItalyJamaicaJapanJordanKazakhstanKenyaKiribatiKorea, Rep.KosovoKuwaitKyrgyz RepublicLao PDRLate-demographic dividendLatin America & Caribbean Latin America & Caribbean (excluding high income)Latin America & the Caribbean (IDA & IBRD countries)LatviaLeast developed countries: UN classificationLebanonLesothoLiberiaLibyaLithuaniaLow & middle incomeLow incomeLower middle incomeLuxembourgMacao SAR, ChinaMacedonia, FYRMadagascarMalawiMalaysiaMaldivesMaliMaltaMauritaniaMauritiusMexicoMicronesia, Fed. Sts.Middle East & North AfricaMiddle East & North Africa (excluding high income)Middle East & North Africa (IDA & IBRD countries)Middle incomeMoldovaMongoliaMontenegroMoroccoMozambiqueNamibiaNepalNetherlandsNew CaledoniaNew ZealandNicaraguaNigerNigeriaNorth AmericaNorwayOECD membersOmanPacific island small statesPakistanPanamaPapua New GuineaParaguayPeruPhilippinesPolandPortugalPost-demographic dividendPre-demographic dividendPuerto RicoRomaniaRussian FederationRwandaSaudi ArabiaSenegalSerbiaSeychellesSierra LeoneSingaporeSlovak RepublicSloveniaSolomon IslandsSomaliaSouth AfricaSouth AsiaSouth Asia (IDA & IBRD)South SudanSpainSri LankaSt. Kitts and NevisSt. LuciaSt. Vincent and the GrenadinesSub-Saharan Africa Sub-Saharan Africa (excluding high income)Sub-Saharan Africa (IDA & IBRD countries)SudanSurinameSwazilandSwedenSwitzerlandSyrian Arab RepublicTajikistanTanzaniaThailandTimor-LesteTogoTongaTrinidad and TobagoTunisiaTurkeyTurkmenistanUgandaUkraineUnited Arab EmiratesUnited KingdomUnited StatesUpper middle incomeUruguayUzbekistanVanuatuVenezuela, RBVietnamWest Bank and GazaWorldYemen, Rep.ZambiaZimbabwe Linha do tempo:
Nesta escala de tempo está apresentado um gráfico de 1966 ano até 2016 ano El Salvador. Dados de 1965 ano ausente. O número de observações reais por data: 51.
Fonte (nome):
Indicadores de desenvolvimento mundial
Fonte (organização):
World Bank national accounts data, and OECD National Accounts data files.
Categorias:
Economy & Growth
Foi atualizado:
23 abr 2017 ano
Indicadores de alterações dos valores ao longo dos anos
Mínimo:
11.179
1 jan 1969 ano
Máximo:
23.271
1 jan 1979 ano
Na data de observação
Valor
Mudança absoluta
A alteração em relação ao valor anterior
1 jan 1966 ano
14.683
+14.683
0.0%
1 jan 1967 ano
14.984
+0.301
2.05%
1 jan 1968 ano
14.714
-0.27
-1.8%
1 jan 1969 ano
11.179
-3.535
-24.03%
1 jan 1970 ano
11.862
+0.683
6.11%
1 jan 1971 ano
11.98
+0.118
0.99%
1 jan 1972 ano
13.287
+1.307
10.91%
1 jan 1973 ano
16.456
+3.169
23.85%
1 jan 1974 ano
15.639
-0.817
-4.97%
1 jan 1975 ano
18.22
+2.581
16.5%
1 jan 1976 ano
23.018
+4.798
26.33%
1 jan 1977 ano
20.073
-2.944
-12.79%
1 jan 1978 ano
21.209
+1.135
5.66%
1 jan 1979 ano
23.271
+2.063
9.73%
1 jan 1980 ano
17.569
-5.703
-24.5%
1 jan 1981 ano
13.578
-3.991
-22.71%
1 jan 1982 ano
13.572
-0.007
-0.05%
1 jan 1983 ano
12.6
-0.971
-7.16%
1 jan 1984 ano
11.622
-0.978
-7.76%
1 jan 1985 ano
11.459
-0.163
-1.4%
1 jan 1986 ano
12.024
+0.565
4.93%
1 jan 1987 ano
13.121
+1.097
9.12%
1 jan 1988 ano
13.649
+0.528
4.02%
1 jan 1989 ano
12.627
-1.022
-7.49%
1 jan 1990 ano
13.323
+0.696
5.51%
1 jan 1991 ano
13.714
+0.391
2.94%
1 jan 1992 ano
15.157
+1.443
10.52%
1 jan 1993 ano
17.176
+2.019
13.32%
1 jan 1994 ano
17.788
+0.611
3.56%
1 jan 1995 ano
18.47
+0.682
3.84%
1 jan 1996 ano
18.715
+0.245
1.33%
1 jan 1997 ano
15.805
-2.909
-15.55%
1 jan 1998 ano
16.076
+0.271
1.71%
1 jan 1999 ano
16.672
+0.596
3.71%
1 jan 2000 ano
16.065
-0.606
-3.64%
1 jan 2001 ano
16.933
+0.868
5.4%
1 jan 2002 ano
16.43
-0.503
-2.97%
1 jan 2003 ano
16.595
+0.165
1.01%
1 jan 2004 ano
16.686
+0.091
0.55%
1 jan 2005 ano
15.659
-1.027
-6.16%
1 jan 2006 ano
15.274
-0.385
-2.46%
1 jan 2007 ano
16.236
+0.962
6.3%
1 jan 2008 ano
16.311
+0.075
0.46%
1 jan 2009 ano
15.201
-1.111
-6.81%
1 jan 2010 ano
13.434
-1.767
-11.62%
1 jan 2011 ano
13.318
-0.116
-0.86%
1 jan 2012 ano
14.362
+1.044
7.84%
1 jan 2013 ano
14.142
-0.22
-1.53%
1 jan 2014 ano
14.96
+0.817
5.78%
1 jan 2015 ano
13.628
-1.332
-8.9%
1 jan 2016 ano
13.983
+0.355
2.61%
Classificação de países por estatísticas atuais por anos


Comentários: