29
/pt/
pt
AIzaSyAYiBZKx7MnpbEhh9jyipgxe19OcubqV5w
April 1, 2024
118968
Denmark
DNK
true
2
1
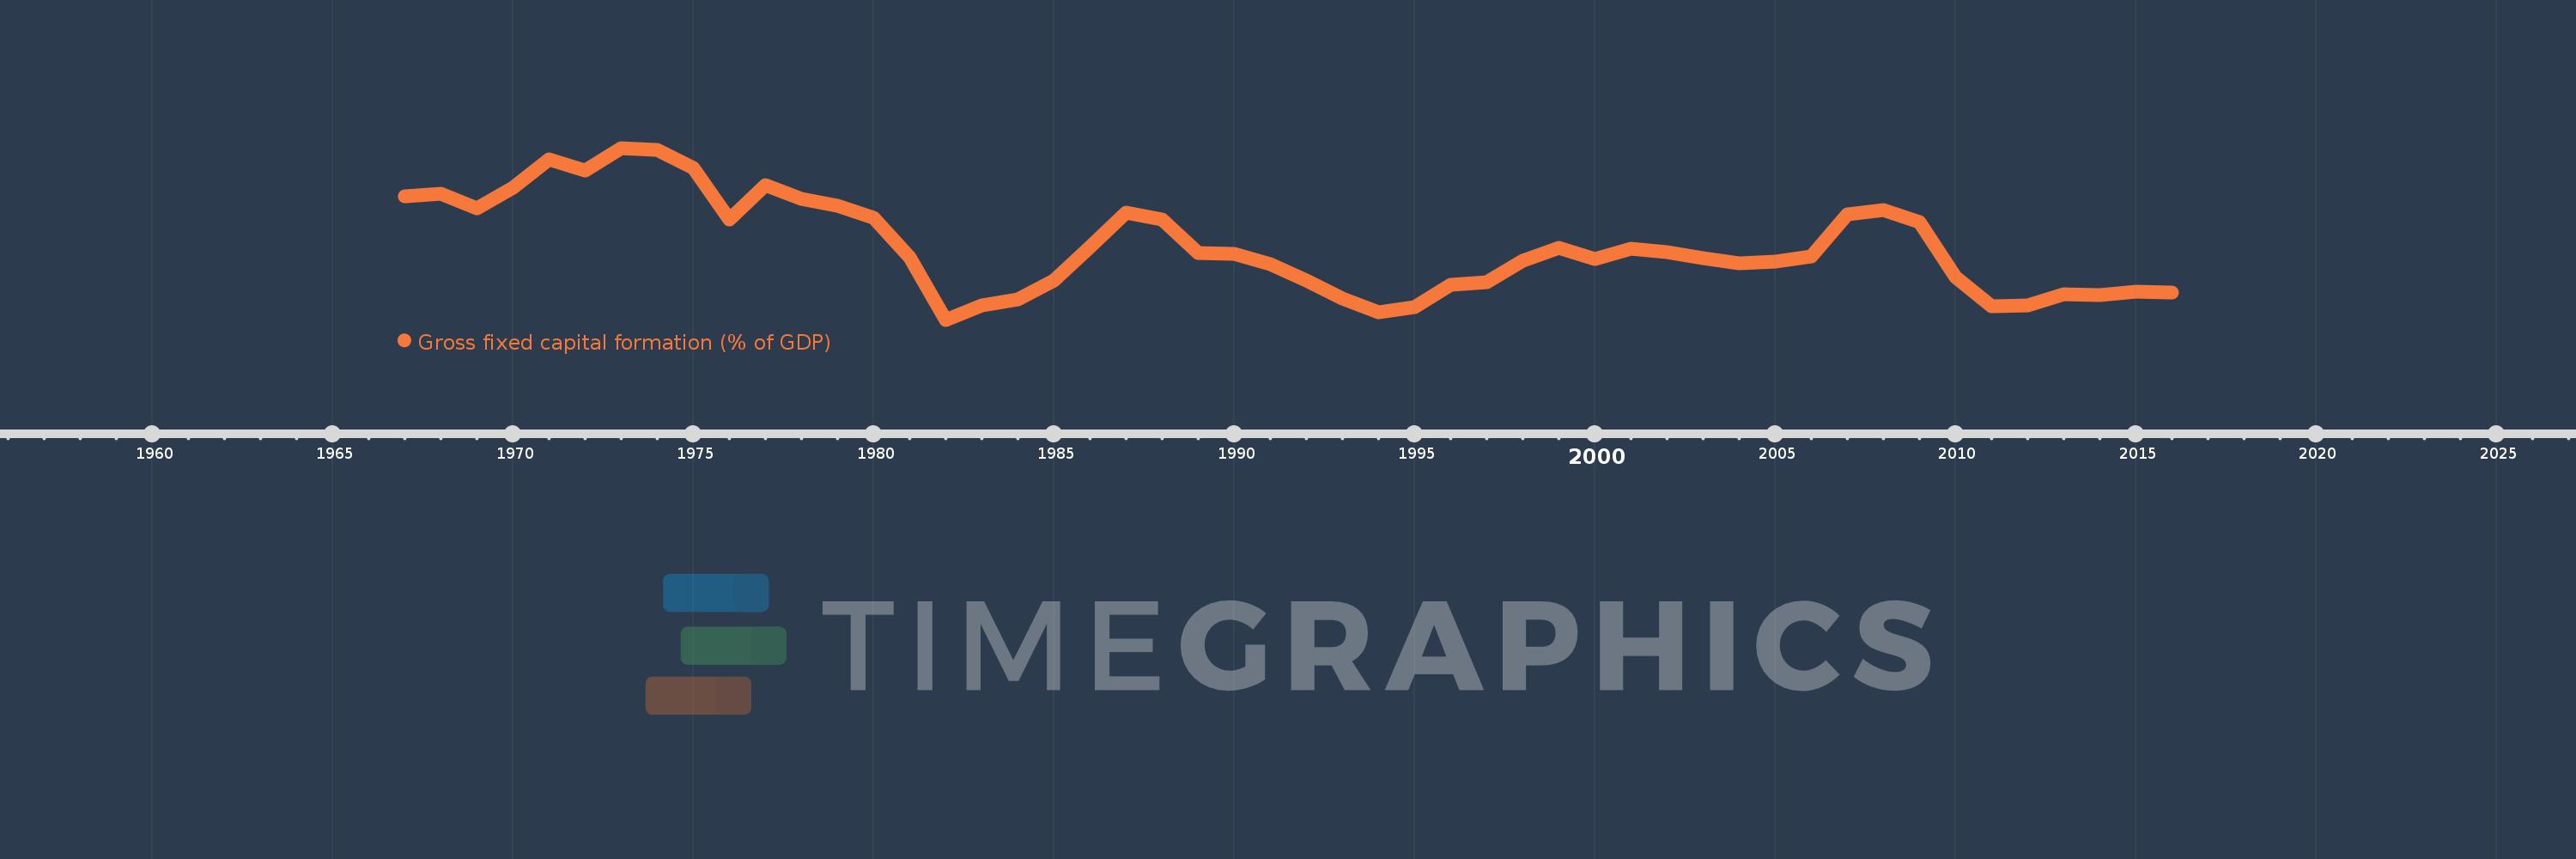
Gross fixed capital formation (% of GDP)
2016,2015,2014,2013,2012,2011,2010,2009,2008,2007,2006,2005,2004,2003,2002,2001,2000,1999,1998,1997,1996,1995,1994,1993,1992,1991,1990,1989,1988,1987,1986,1985,1984,1983,1982,1981,1980,1979,1978,1977,1976,1975,1974,1973,1972,1971,1970,1969,1968,1967
Estas estatísticas em outros países:
AfghanistanAlbaniaAlgeriaAngolaAntigua and BarbudaArab WorldArgentinaArmeniaArubaAustraliaAustriaAzerbaijanBahamas, TheBahrainBangladeshBarbadosBelarusBelgiumBelizeBeninBermudaBhutanBoliviaBosnia and HerzegovinaBotswanaBrazilBrunei DarussalamBulgariaBurkina FasoBurundiCabo VerdeCambodiaCameroonCanadaCaribbean small statesCentral African RepublicCentral Europe and the BalticsChadChileChinaColombiaComorosCongo, Dem. Rep.Congo, Rep.Costa RicaCote d'IvoireCroatiaCubaCyprusCzech RepublicDenmarkDjiboutiDominicaDominican RepublicEarly-demographic dividendEast Asia & PacificEast Asia & Pacific (excluding high income)East Asia & Pacific (IDA & IBRD countries)EcuadorEgypt, Arab Rep.El SalvadorEquatorial GuineaEritreaEstoniaEthiopiaEuro areaEurope & Central AsiaEurope & Central Asia (excluding high income)Europe & Central Asia (IDA & IBRD countries)European UnionFijiFinlandFragile and conflict affected situationsFranceGabonGambia, TheGeorgiaGermanyGhanaGreeceGrenadaGuatemalaGuineaGuinea-BissauGuyanaHaitiHeavily indebted poor countries (HIPC)High incomeHondurasHong Kong SAR, ChinaHungaryIBRD onlyIcelandIDA & IBRD totalIDA blendIDA onlyIDA totalIndiaIndonesiaIran, Islamic Rep.IraqIrelandIsraelItalyJamaicaJapanJordanKazakhstanKenyaKiribatiKorea, Rep.KosovoKuwaitKyrgyz RepublicLao PDRLate-demographic dividendLatin America & Caribbean Latin America & Caribbean (excluding high income)Latin America & the Caribbean (IDA & IBRD countries)LatviaLeast developed countries: UN classificationLebanonLesothoLiberiaLibyaLithuaniaLow & middle incomeLow incomeLower middle incomeLuxembourgMacao SAR, ChinaMacedonia, FYRMadagascarMalawiMalaysiaMaldivesMaliMaltaMauritaniaMauritiusMexicoMicronesia, Fed. Sts.Middle East & North AfricaMiddle East & North Africa (excluding high income)Middle East & North Africa (IDA & IBRD countries)Middle incomeMoldovaMongoliaMontenegroMoroccoMozambiqueNamibiaNepalNetherlandsNew CaledoniaNew ZealandNicaraguaNigerNigeriaNorth AmericaNorwayOECD membersOmanPacific island small statesPakistanPanamaPapua New GuineaParaguayPeruPhilippinesPolandPortugalPost-demographic dividendPre-demographic dividendPuerto RicoRomaniaRussian FederationRwandaSaudi ArabiaSenegalSerbiaSeychellesSierra LeoneSingaporeSlovak RepublicSloveniaSolomon IslandsSomaliaSouth AfricaSouth AsiaSouth Asia (IDA & IBRD)South SudanSpainSri LankaSt. Kitts and NevisSt. LuciaSt. Vincent and the GrenadinesSub-Saharan Africa Sub-Saharan Africa (excluding high income)Sub-Saharan Africa (IDA & IBRD countries)SudanSurinameSwazilandSwedenSwitzerlandSyrian Arab RepublicTajikistanTanzaniaThailandTimor-LesteTogoTongaTrinidad and TobagoTunisiaTurkeyTurkmenistanUgandaUkraineUnited Arab EmiratesUnited KingdomUnited StatesUpper middle incomeUruguayUzbekistanVanuatuVenezuela, RBVietnamWest Bank and GazaWorldYemen, Rep.ZambiaZimbabwe Linha do tempo:
Nesta escala de tempo está apresentado um gráfico de 1967 ano até 2016 ano Denmark. Dados de 1966 ano ausente. O número de observações reais por data: 50.
Fonte (nome):
Indicadores de desenvolvimento mundial
Fonte (organização):
World Bank national accounts data, and OECD National Accounts data files.
Categorias:
Economy & Growth
Foi atualizado:
23 abr 2017 ano
Indicadores de alterações dos valores ao longo dos anos
Mínimo:
17.504
1 jan 1982 ano
Máximo:
27.203
1 jan 1973 ano
Na data de observação
Valor
Mudança absoluta
A alteração em relação ao valor anterior
1 jan 1967 ano
24.487
+24.487
0.0%
1 jan 1968 ano
24.599
+0.112
0.46%
1 jan 1969 ano
23.773
-0.826
-3.36%
1 jan 1970 ano
24.944
+1.172
4.93%
1 jan 1971 ano
26.566
+1.622
6.5%
1 jan 1972 ano
25.939
-0.628
-2.36%
1 jan 1973 ano
27.203
+1.265
4.88%
1 jan 1974 ano
27.08
-0.123
-0.45%
1 jan 1975 ano
26.058
-1.022
-3.78%
1 jan 1976 ano
23.163
-2.895
-11.11%
1 jan 1977 ano
25.118
+1.955
8.44%
1 jan 1978 ano
24.306
-0.812
-3.23%
1 jan 1979 ano
23.962
-0.343
-1.41%
1 jan 1980 ano
23.237
-0.726
-3.03%
1 jan 1981 ano
21.016
-2.221
-9.56%
1 jan 1982 ano
17.504
-3.512
-16.71%
1 jan 1983 ano
18.324
+0.82
4.69%
1 jan 1984 ano
18.657
+0.333
1.82%
1 jan 1985 ano
19.73
+1.073
5.75%
1 jan 1986 ano
21.603
+1.873
9.49%
1 jan 1987 ano
23.575
+1.971
9.13%
1 jan 1988 ano
23.142
-0.433
-1.84%
1 jan 1989 ano
21.285
-1.857
-8.02%
1 jan 1990 ano
21.216
-0.069
-0.32%
1 jan 1991 ano
20.665
-0.552
-2.6%
1 jan 1992 ano
19.744
-0.921
-4.46%
1 jan 1993 ano
18.684
-1.06
-5.37%
1 jan 1994 ano
17.918
-0.765
-4.1%
1 jan 1995 ano
18.226
+0.308
1.72%
1 jan 1996 ano
19.475
+1.248
6.85%
1 jan 1997 ano
19.605
+0.13
0.67%
1 jan 1998 ano
20.815
+1.21
6.17%
1 jan 1999 ano
21.566
+0.751
3.61%
1 jan 2000 ano
20.92
-0.646
-3.0%
1 jan 2001 ano
21.508
+0.588
2.81%
1 jan 2002 ano
21.303
-0.204
-0.95%
1 jan 2003 ano
20.985
-0.319
-1.5%
1 jan 2004 ano
20.699
-0.285
-1.36%
1 jan 2005 ano
20.808
+0.109
0.53%
1 jan 2006 ano
21.071
+0.263
1.27%
1 jan 2007 ano
23.454
+2.383
11.31%
1 jan 2008 ano
23.69
+0.235
1.0%
1 jan 2009 ano
22.995
-0.694
-2.93%
1 jan 2010 ano
19.912
-3.083
-13.41%
1 jan 2011 ano
18.26
-1.653
-8.3%
1 jan 2012 ano
18.303
+0.043
0.24%
1 jan 2013 ano
18.952
+0.649
3.54%
1 jan 2014 ano
18.901
-0.051
-0.27%
1 jan 2015 ano
19.082
+0.181
0.96%
1 jan 2016 ano
19.035
-0.048
-0.25%
Classificação de países por estatísticas atuais por anos


Comentários: