29
/pt/
pt
AIzaSyAYiBZKx7MnpbEhh9jyipgxe19OcubqV5w
April 1, 2024
157343
Iran, Islamic Rep.
IRN
true
2
1
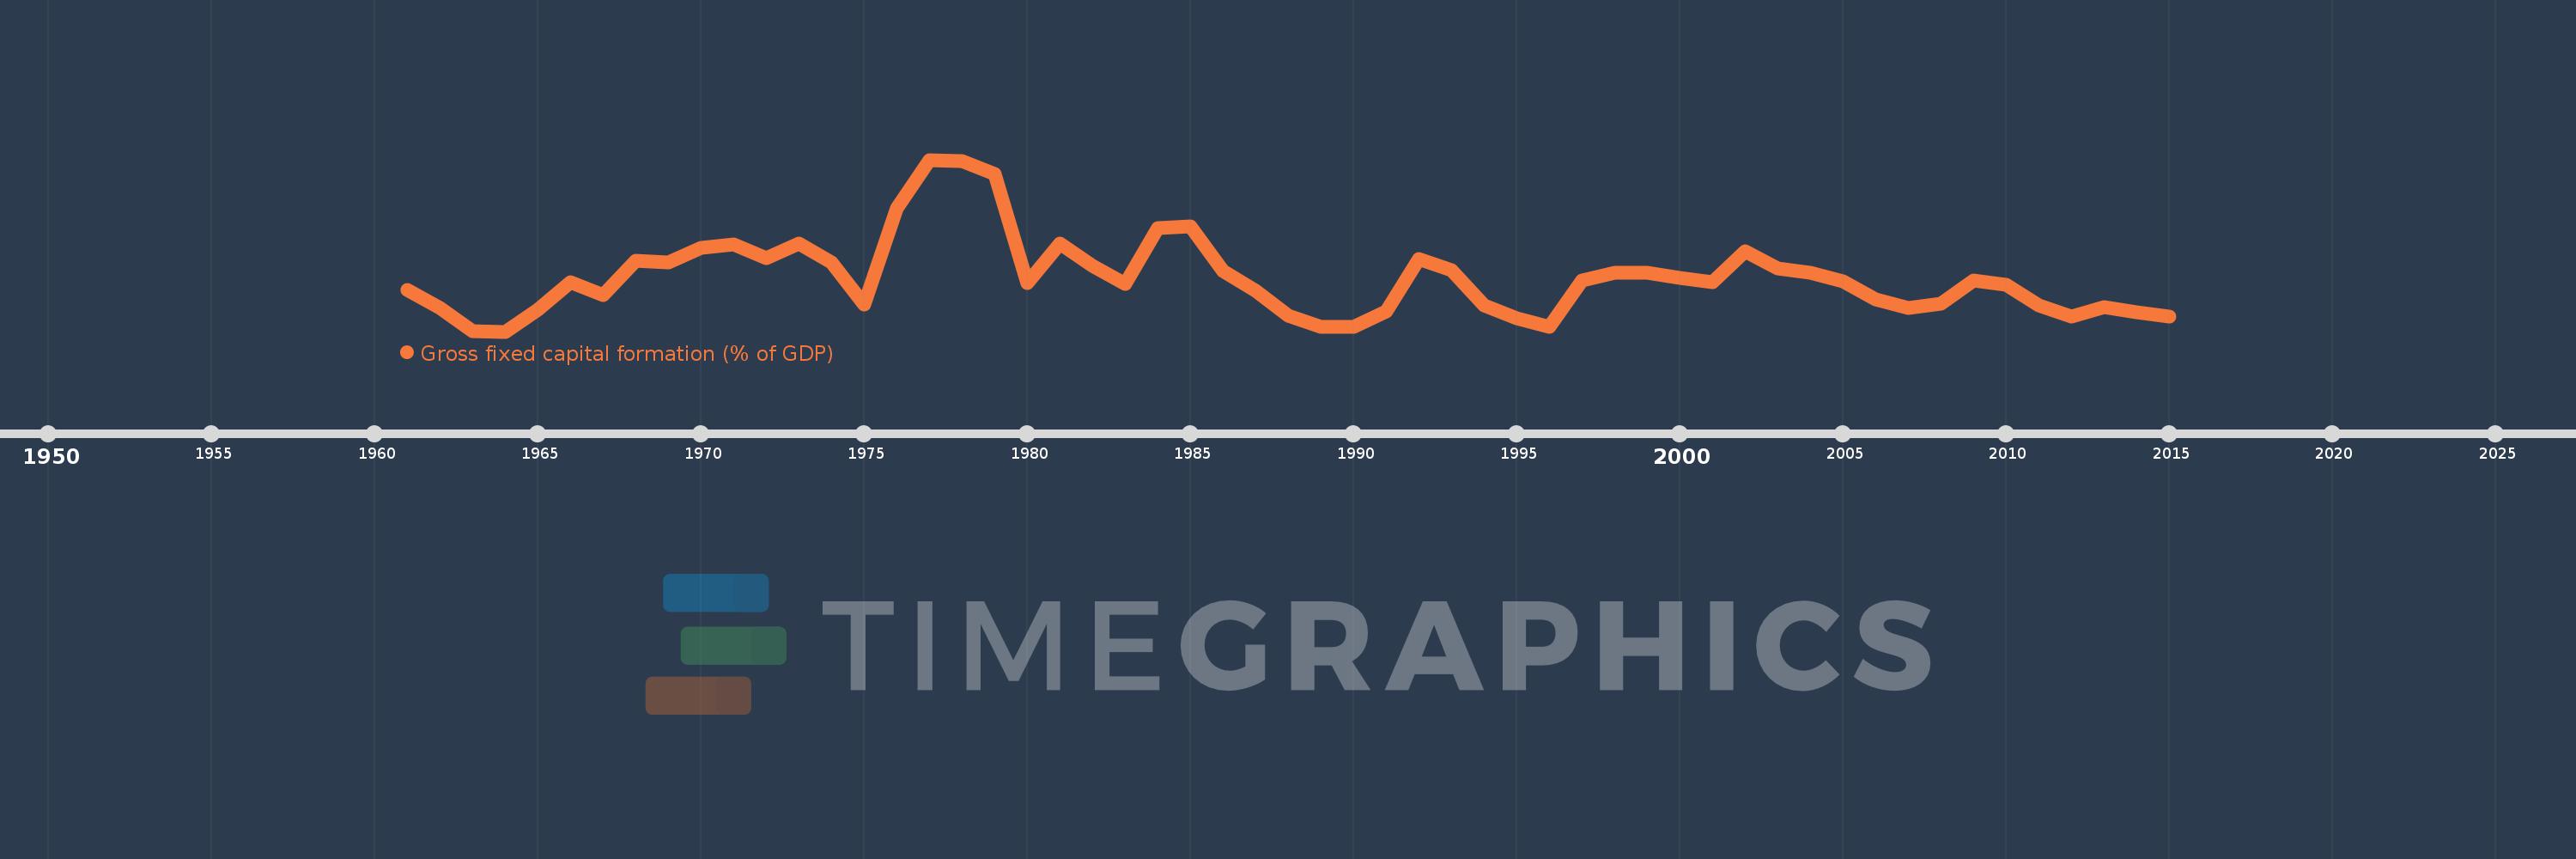
Gross fixed capital formation (% of GDP)
2015,2014,2013,2012,2011,2010,2009,2008,2007,2006,2005,2004,2003,2002,2001,2000,1999,1998,1997,1996,1995,1994,1993,1992,1991,1990,1989,1988,1987,1986,1985,1984,1983,1982,1981,1980,1979,1978,1977,1976,1975,1974,1973,1972,1971,1970,1969,1968,1967,1966,1965,1964,1963,1962,1961
Estas estatísticas em outros países:
AfghanistanAlbaniaAlgeriaAngolaAntigua and BarbudaArab WorldArgentinaArmeniaArubaAustraliaAustriaAzerbaijanBahamas, TheBahrainBangladeshBarbadosBelarusBelgiumBelizeBeninBermudaBhutanBoliviaBosnia and HerzegovinaBotswanaBrazilBrunei DarussalamBulgariaBurkina FasoBurundiCabo VerdeCambodiaCameroonCanadaCaribbean small statesCentral African RepublicCentral Europe and the BalticsChadChileChinaColombiaComorosCongo, Dem. Rep.Congo, Rep.Costa RicaCote d'IvoireCroatiaCubaCyprusCzech RepublicDenmarkDjiboutiDominicaDominican RepublicEarly-demographic dividendEast Asia & PacificEast Asia & Pacific (excluding high income)East Asia & Pacific (IDA & IBRD countries)EcuadorEgypt, Arab Rep.El SalvadorEquatorial GuineaEritreaEstoniaEthiopiaEuro areaEurope & Central AsiaEurope & Central Asia (excluding high income)Europe & Central Asia (IDA & IBRD countries)European UnionFijiFinlandFragile and conflict affected situationsFranceGabonGambia, TheGeorgiaGermanyGhanaGreeceGrenadaGuatemalaGuineaGuinea-BissauGuyanaHaitiHeavily indebted poor countries (HIPC)High incomeHondurasHong Kong SAR, ChinaHungaryIBRD onlyIcelandIDA & IBRD totalIDA blendIDA onlyIDA totalIndiaIndonesiaIran, Islamic Rep.IraqIrelandIsraelItalyJamaicaJapanJordanKazakhstanKenyaKiribatiKorea, Rep.KosovoKuwaitKyrgyz RepublicLao PDRLate-demographic dividendLatin America & Caribbean Latin America & Caribbean (excluding high income)Latin America & the Caribbean (IDA & IBRD countries)LatviaLeast developed countries: UN classificationLebanonLesothoLiberiaLibyaLithuaniaLow & middle incomeLow incomeLower middle incomeLuxembourgMacao SAR, ChinaMacedonia, FYRMadagascarMalawiMalaysiaMaldivesMaliMaltaMauritaniaMauritiusMexicoMicronesia, Fed. Sts.Middle East & North AfricaMiddle East & North Africa (excluding high income)Middle East & North Africa (IDA & IBRD countries)Middle incomeMoldovaMongoliaMontenegroMoroccoMozambiqueNamibiaNepalNetherlandsNew CaledoniaNew ZealandNicaraguaNigerNigeriaNorth AmericaNorwayOECD membersOmanPacific island small statesPakistanPanamaPapua New GuineaParaguayPeruPhilippinesPolandPortugalPost-demographic dividendPre-demographic dividendPuerto RicoRomaniaRussian FederationRwandaSaudi ArabiaSenegalSerbiaSeychellesSierra LeoneSingaporeSlovak RepublicSloveniaSolomon IslandsSomaliaSouth AfricaSouth AsiaSouth Asia (IDA & IBRD)South SudanSpainSri LankaSt. Kitts and NevisSt. LuciaSt. Vincent and the GrenadinesSub-Saharan Africa Sub-Saharan Africa (excluding high income)Sub-Saharan Africa (IDA & IBRD countries)SudanSurinameSwazilandSwedenSwitzerlandSyrian Arab RepublicTajikistanTanzaniaThailandTimor-LesteTogoTongaTrinidad and TobagoTunisiaTurkeyTurkmenistanUgandaUkraineUnited Arab EmiratesUnited KingdomUnited StatesUpper middle incomeUruguayUzbekistanVanuatuVenezuela, RBVietnamWest Bank and GazaWorldYemen, Rep.ZambiaZimbabwe Linha do tempo:
Nesta escala de tempo está apresentado um gráfico de 1961 ano até 2015 ano Iran, Islamic Rep.. Dados de 1960 ano ausente. O número de observações reais por data: 55.
Fonte (nome):
Indicadores de desenvolvimento mundial
Fonte (organização):
World Bank national accounts data, and OECD National Accounts data files.
Categorias:
Economy & Growth
Foi atualizado:
23 abr 2017 ano
Indicadores de alterações dos valores ao longo dos anos
Mínimo:
23.949
1 jan 1964 ano
Máximo:
49.316
1 jan 1977 ano
Na data de observação
Valor
Mudança absoluta
A alteração em relação ao valor anterior
1 jan 1961 ano
30.117
+30.117
0.0%
1 jan 1962 ano
27.415
-2.702
-8.97%
1 jan 1963 ano
24.035
-3.38
-12.33%
1 jan 1964 ano
23.949
-0.086
-0.36%
1 jan 1965 ano
27.179
+3.23
13.49%
1 jan 1966 ano
31.283
+4.104
15.1%
1 jan 1967 ano
29.289
-1.995
-6.38%
1 jan 1968 ano
34.435
+5.146
17.57%
1 jan 1969 ano
34.201
-0.234
-0.68%
1 jan 1970 ano
36.29
+2.089
6.11%
1 jan 1971 ano
36.82
+0.53
1.46%
1 jan 1972 ano
34.757
-2.063
-5.6%
1 jan 1973 ano
36.913
+2.156
6.2%
1 jan 1974 ano
34.211
-2.702
-7.32%
1 jan 1975 ano
27.965
-6.246
-18.26%
1 jan 1976 ano
42.205
+14.24
50.92%
1 jan 1977 ano
49.316
+7.111
16.85%
1 jan 1978 ano
49.134
-0.183
-0.37%
1 jan 1979 ano
47.258
-1.876
-3.82%
1 jan 1980 ano
31.104
-16.154
-34.18%
1 jan 1981 ano
36.922
+5.818
18.71%
1 jan 1982 ano
33.604
-3.318
-8.99%
1 jan 1983 ano
30.949
-2.656
-7.9%
1 jan 1984 ano
39.185
+8.236
26.61%
1 jan 1985 ano
39.435
+0.25
0.64%
1 jan 1986 ano
32.879
-6.557
-16.63%
1 jan 1987 ano
29.97
-2.909
-8.85%
1 jan 1988 ano
26.26
-3.71
-12.38%
1 jan 1989 ano
24.599
-1.662
-6.33%
1 jan 1990 ano
24.661
+0.063
0.25%
1 jan 1991 ano
26.983
+2.322
9.42%
1 jan 1992 ano
34.675
+7.692
28.51%
1 jan 1993 ano
33.017
-1.658
-4.78%
1 jan 1994 ano
27.828
-5.189
-15.72%
1 jan 1995 ano
25.964
-1.864
-6.7%
1 jan 1996 ano
24.689
-1.275
-4.91%
1 jan 1997 ano
31.465
+6.776
27.44%
1 jan 1998 ano
32.65
+1.186
3.77%
1 jan 1999 ano
32.638
-0.012
-0.04%
1 jan 2000 ano
31.844
-0.794
-2.43%
1 jan 2001 ano
31.305
-0.539
-1.69%
1 jan 2002 ano
35.799
+4.494
14.36%
1 jan 2003 ano
33.246
-2.554
-7.13%
1 jan 2004 ano
32.658
-0.588
-1.77%
1 jan 2005 ano
31.368
-1.29
-3.95%
1 jan 2006 ano
28.737
-2.631
-8.39%
1 jan 2007 ano
27.419
-1.317
-4.58%
1 jan 2008 ano
28.107
+0.688
2.51%
1 jan 2009 ano
31.558
+3.451
12.28%
1 jan 2010 ano
30.898
-0.66
-2.09%
1 jan 2011 ano
27.797
-3.102
-10.04%
1 jan 2012 ano
26.231
-1.566
-5.63%
1 jan 2013 ano
27.597
+1.366
5.21%
1 jan 2014 ano
26.834
-0.763
-2.76%
1 jan 2015 ano
26.165
-0.669
-2.49%
Classificação de países por estatísticas atuais por anos


Comentários: