29
/pt/
pt
AIzaSyAYiBZKx7MnpbEhh9jyipgxe19OcubqV5w
April 1, 2024
209373
New Zealand
NZL
true
2
1
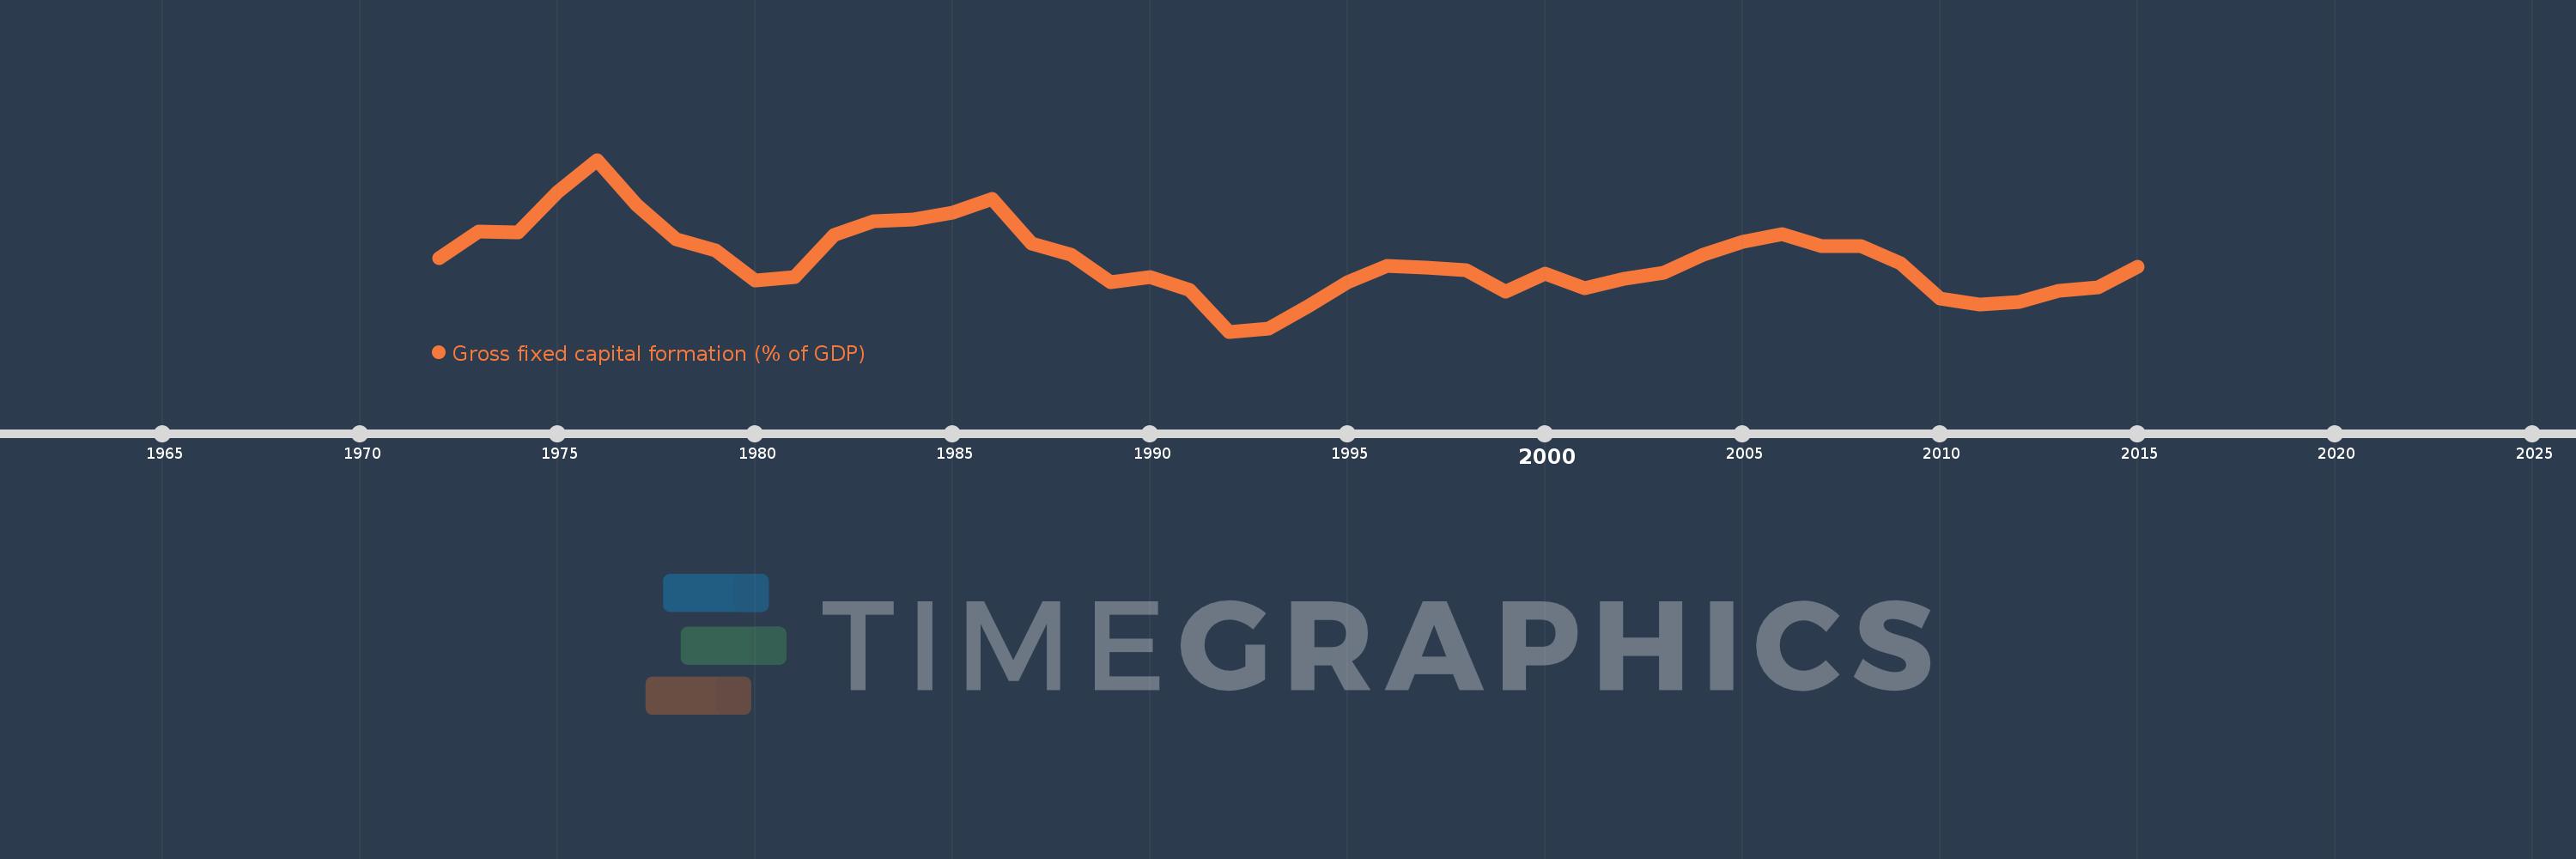
Gross fixed capital formation (% of GDP)
2015,2014,2013,2012,2011,2010,2009,2008,2007,2006,2005,2004,2003,2002,2001,2000,1999,1998,1997,1996,1995,1994,1993,1992,1991,1990,1989,1988,1987,1986,1985,1984,1983,1982,1981,1980,1979,1978,1977,1976,1975,1974,1973,1972
Estas estatísticas em outros países:
AfghanistanAlbaniaAlgeriaAngolaAntigua and BarbudaArab WorldArgentinaArmeniaArubaAustraliaAustriaAzerbaijanBahamas, TheBahrainBangladeshBarbadosBelarusBelgiumBelizeBeninBermudaBhutanBoliviaBosnia and HerzegovinaBotswanaBrazilBrunei DarussalamBulgariaBurkina FasoBurundiCabo VerdeCambodiaCameroonCanadaCaribbean small statesCentral African RepublicCentral Europe and the BalticsChadChileChinaColombiaComorosCongo, Dem. Rep.Congo, Rep.Costa RicaCote d'IvoireCroatiaCubaCyprusCzech RepublicDenmarkDjiboutiDominicaDominican RepublicEarly-demographic dividendEast Asia & PacificEast Asia & Pacific (excluding high income)East Asia & Pacific (IDA & IBRD countries)EcuadorEgypt, Arab Rep.El SalvadorEquatorial GuineaEritreaEstoniaEthiopiaEuro areaEurope & Central AsiaEurope & Central Asia (excluding high income)Europe & Central Asia (IDA & IBRD countries)European UnionFijiFinlandFragile and conflict affected situationsFranceGabonGambia, TheGeorgiaGermanyGhanaGreeceGrenadaGuatemalaGuineaGuinea-BissauGuyanaHaitiHeavily indebted poor countries (HIPC)High incomeHondurasHong Kong SAR, ChinaHungaryIBRD onlyIcelandIDA & IBRD totalIDA blendIDA onlyIDA totalIndiaIndonesiaIran, Islamic Rep.IraqIrelandIsraelItalyJamaicaJapanJordanKazakhstanKenyaKiribatiKorea, Rep.KosovoKuwaitKyrgyz RepublicLao PDRLate-demographic dividendLatin America & Caribbean Latin America & Caribbean (excluding high income)Latin America & the Caribbean (IDA & IBRD countries)LatviaLeast developed countries: UN classificationLebanonLesothoLiberiaLibyaLithuaniaLow & middle incomeLow incomeLower middle incomeLuxembourgMacao SAR, ChinaMacedonia, FYRMadagascarMalawiMalaysiaMaldivesMaliMaltaMauritaniaMauritiusMexicoMicronesia, Fed. Sts.Middle East & North AfricaMiddle East & North Africa (excluding high income)Middle East & North Africa (IDA & IBRD countries)Middle incomeMoldovaMongoliaMontenegroMoroccoMozambiqueNamibiaNepalNetherlandsNew CaledoniaNew ZealandNicaraguaNigerNigeriaNorth AmericaNorwayOECD membersOmanPacific island small statesPakistanPanamaPapua New GuineaParaguayPeruPhilippinesPolandPortugalPost-demographic dividendPre-demographic dividendPuerto RicoRomaniaRussian FederationRwandaSaudi ArabiaSenegalSerbiaSeychellesSierra LeoneSingaporeSlovak RepublicSloveniaSolomon IslandsSomaliaSouth AfricaSouth AsiaSouth Asia (IDA & IBRD)South SudanSpainSri LankaSt. Kitts and NevisSt. LuciaSt. Vincent and the GrenadinesSub-Saharan Africa Sub-Saharan Africa (excluding high income)Sub-Saharan Africa (IDA & IBRD countries)SudanSurinameSwazilandSwedenSwitzerlandSyrian Arab RepublicTajikistanTanzaniaThailandTimor-LesteTogoTongaTrinidad and TobagoTunisiaTurkeyTurkmenistanUgandaUkraineUnited Arab EmiratesUnited KingdomUnited StatesUpper middle incomeUruguayUzbekistanVanuatuVenezuela, RBVietnamWest Bank and GazaWorldYemen, Rep.ZambiaZimbabwe Linha do tempo:
Nesta escala de tempo está apresentado um gráfico de 1972 ano até 2015 ano New Zealand. Dados de 1971 ano ausente. O número de observações reais por data: 44.
Fonte (nome):
Indicadores de desenvolvimento mundial
Fonte (organização):
World Bank national accounts data, and OECD National Accounts data files.
Categorias:
Economy & Growth
Foi atualizado:
23 abr 2017 ano
Indicadores de alterações dos valores ao longo dos anos
Mínimo:
17.66
1 jan 1992 ano
Máximo:
30.198
1 jan 1976 ano
Na data de observação
Valor
Mudança absoluta
A alteração em relação ao valor anterior
1 jan 1972 ano
23.016
+23.016
0.0%
1 jan 1973 ano
24.949
+1.933
8.4%
1 jan 1974 ano
24.878
-0.071
-0.29%
1 jan 1975 ano
27.837
+2.959
11.89%
1 jan 1976 ano
30.198
+2.362
8.48%
1 jan 1977 ano
26.905
-3.294
-10.91%
1 jan 1978 ano
24.402
-2.503
-9.3%
1 jan 1979 ano
23.56
-0.842
-3.45%
1 jan 1980 ano
21.387
-2.173
-9.23%
1 jan 1981 ano
21.663
+0.276
1.29%
1 jan 1982 ano
24.703
+3.04
14.03%
1 jan 1983 ano
25.731
+1.028
4.16%
1 jan 1984 ano
25.838
+0.107
0.42%
1 jan 1985 ano
26.359
+0.521
2.02%
1 jan 1986 ano
27.349
+0.99
3.76%
1 jan 1987 ano
24.093
-3.256
-11.91%
1 jan 1988 ano
23.264
-0.829
-3.44%
1 jan 1989 ano
21.253
-2.011
-8.65%
1 jan 1990 ano
21.634
+0.381
1.79%
1 jan 1991 ano
20.673
-0.961
-4.44%
1 jan 1992 ano
17.66
-3.013
-14.57%
1 jan 1993 ano
17.87
+0.209
1.19%
1 jan 1994 ano
19.532
+1.662
9.3%
1 jan 1995 ano
21.294
+1.762
9.02%
1 jan 1996 ano
22.425
+1.131
5.31%
1 jan 1997 ano
22.345
-0.08
-0.36%
1 jan 1998 ano
22.15
-0.195
-0.87%
1 jan 1999 ano
20.559
-1.591
-7.18%
1 jan 2000 ano
21.876
+1.317
6.4%
1 jan 2001 ano
20.85
-1.025
-4.69%
1 jan 2002 ano
21.487
+0.636
3.05%
1 jan 2003 ano
21.937
+0.45
2.1%
1 jan 2004 ano
23.257
+1.32
6.02%
1 jan 2005 ano
24.218
+0.961
4.13%
1 jan 2006 ano
24.746
+0.528
2.18%
1 jan 2007 ano
23.899
-0.847
-3.42%
1 jan 2008 ano
23.891
-0.008
-0.03%
1 jan 2009 ano
22.652
-1.239
-5.19%
1 jan 2010 ano
20.096
-2.556
-11.28%
1 jan 2011 ano
19.659
-0.438
-2.18%
1 jan 2012 ano
19.849
+0.19
0.97%
1 jan 2013 ano
20.647
+0.798
4.02%
1 jan 2014 ano
20.861
+0.214
1.04%
1 jan 2015 ano
22.42
+1.559
7.47%
Classificação de países por estatísticas atuais por anos


Comentários: