29
/pt/
pt
AIzaSyAYiBZKx7MnpbEhh9jyipgxe19OcubqV5w
April 1, 2024
169967
Korea, Rep.
KOR
true
2
1
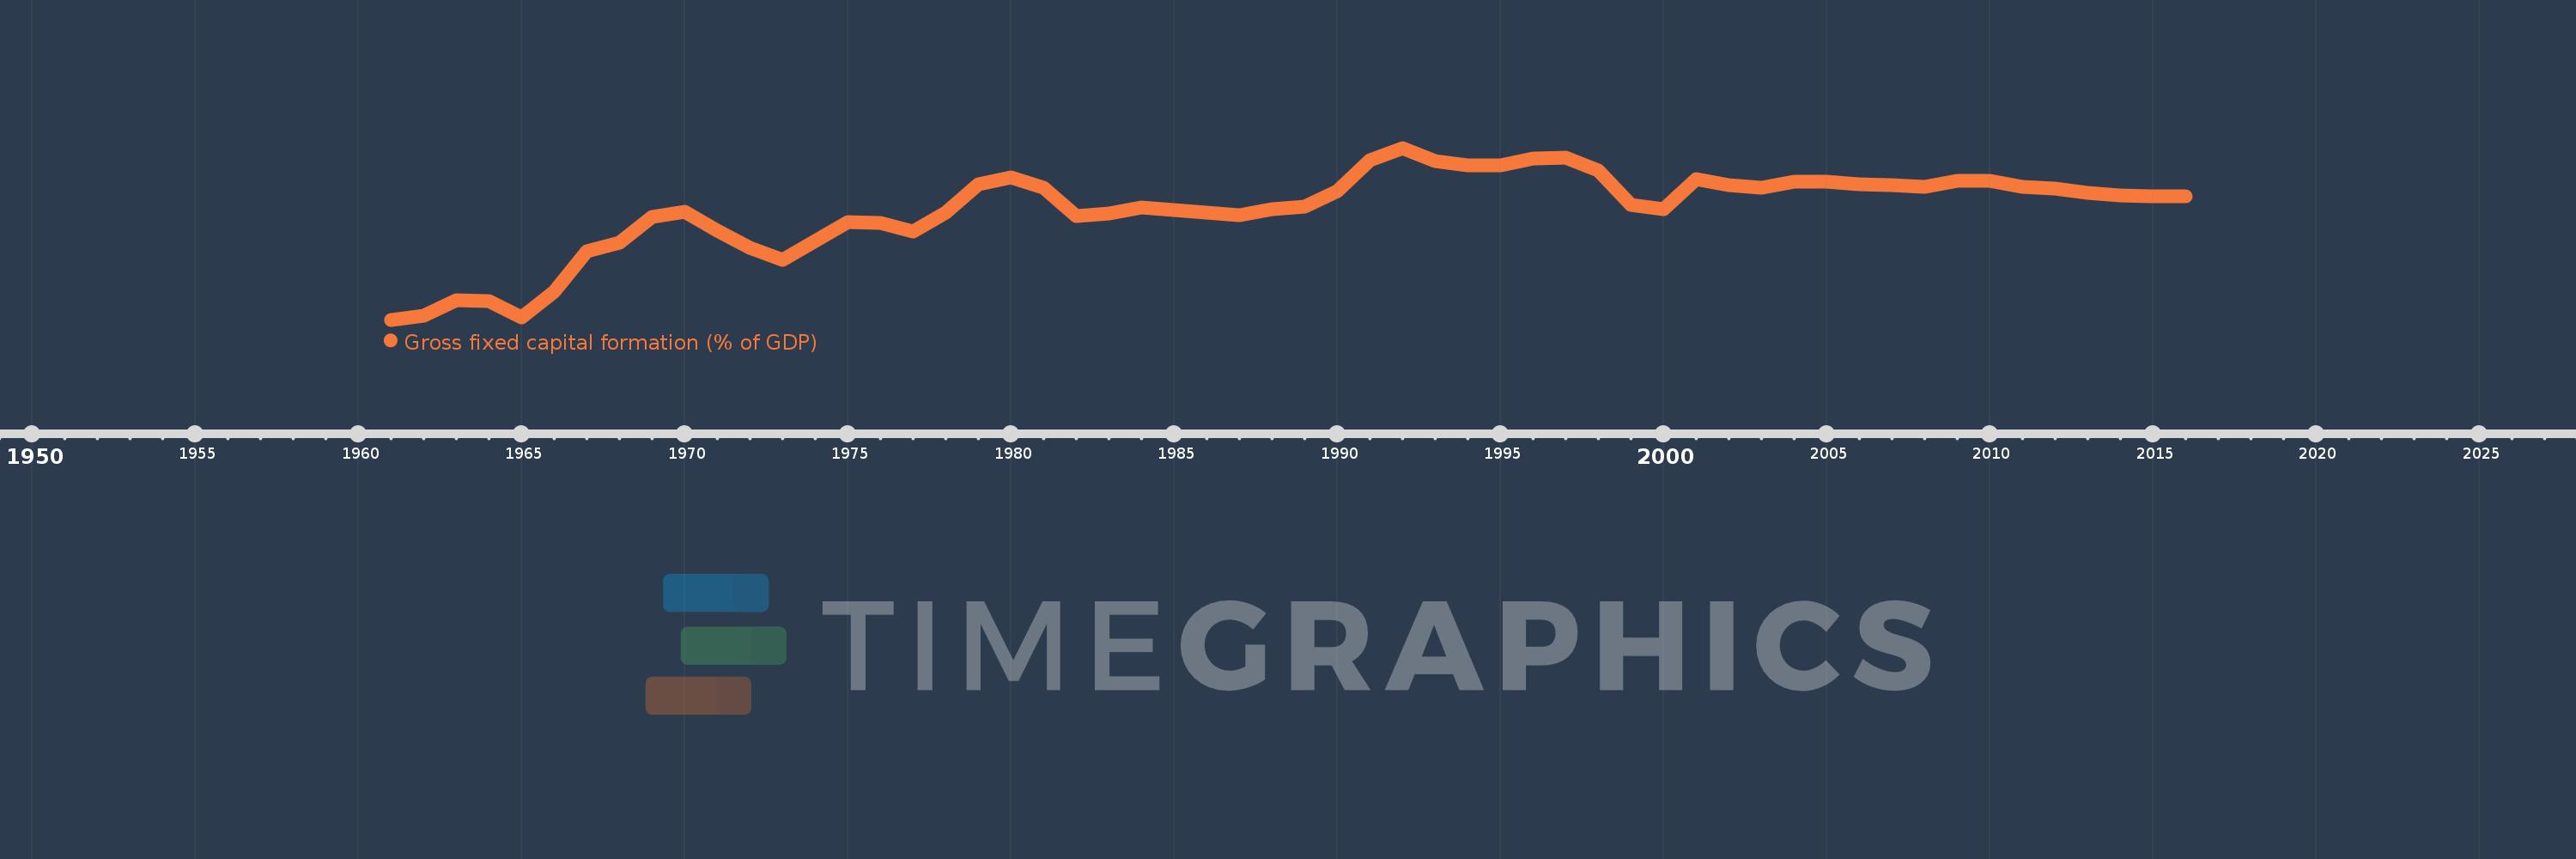
Gross fixed capital formation (% of GDP)
2016,2015,2014,2013,2012,2011,2010,2009,2008,2007,2006,2005,2004,2003,2002,2001,2000,1999,1998,1997,1996,1995,1994,1993,1992,1991,1990,1989,1988,1987,1986,1985,1984,1983,1982,1981,1980,1979,1978,1977,1976,1975,1974,1973,1972,1971,1970,1969,1968,1967,1966,1965,1964,1963,1962,1961
Estas estatísticas em outros países:
AfghanistanAlbaniaAlgeriaAngolaAntigua and BarbudaArab WorldArgentinaArmeniaArubaAustraliaAustriaAzerbaijanBahamas, TheBahrainBangladeshBarbadosBelarusBelgiumBelizeBeninBermudaBhutanBoliviaBosnia and HerzegovinaBotswanaBrazilBrunei DarussalamBulgariaBurkina FasoBurundiCabo VerdeCambodiaCameroonCanadaCaribbean small statesCentral African RepublicCentral Europe and the BalticsChadChileChinaColombiaComorosCongo, Dem. Rep.Congo, Rep.Costa RicaCote d'IvoireCroatiaCubaCyprusCzech RepublicDenmarkDjiboutiDominicaDominican RepublicEarly-demographic dividendEast Asia & PacificEast Asia & Pacific (excluding high income)East Asia & Pacific (IDA & IBRD countries)EcuadorEgypt, Arab Rep.El SalvadorEquatorial GuineaEritreaEstoniaEthiopiaEuro areaEurope & Central AsiaEurope & Central Asia (excluding high income)Europe & Central Asia (IDA & IBRD countries)European UnionFijiFinlandFragile and conflict affected situationsFranceGabonGambia, TheGeorgiaGermanyGhanaGreeceGrenadaGuatemalaGuineaGuinea-BissauGuyanaHaitiHeavily indebted poor countries (HIPC)High incomeHondurasHong Kong SAR, ChinaHungaryIBRD onlyIcelandIDA & IBRD totalIDA blendIDA onlyIDA totalIndiaIndonesiaIran, Islamic Rep.IraqIrelandIsraelItalyJamaicaJapanJordanKazakhstanKenyaKiribatiKorea, Rep.KosovoKuwaitKyrgyz RepublicLao PDRLate-demographic dividendLatin America & Caribbean Latin America & Caribbean (excluding high income)Latin America & the Caribbean (IDA & IBRD countries)LatviaLeast developed countries: UN classificationLebanonLesothoLiberiaLibyaLithuaniaLow & middle incomeLow incomeLower middle incomeLuxembourgMacao SAR, ChinaMacedonia, FYRMadagascarMalawiMalaysiaMaldivesMaliMaltaMauritaniaMauritiusMexicoMicronesia, Fed. Sts.Middle East & North AfricaMiddle East & North Africa (excluding high income)Middle East & North Africa (IDA & IBRD countries)Middle incomeMoldovaMongoliaMontenegroMoroccoMozambiqueNamibiaNepalNetherlandsNew CaledoniaNew ZealandNicaraguaNigerNigeriaNorth AmericaNorwayOECD membersOmanPacific island small statesPakistanPanamaPapua New GuineaParaguayPeruPhilippinesPolandPortugalPost-demographic dividendPre-demographic dividendPuerto RicoRomaniaRussian FederationRwandaSaudi ArabiaSenegalSerbiaSeychellesSierra LeoneSingaporeSlovak RepublicSloveniaSolomon IslandsSomaliaSouth AfricaSouth AsiaSouth Asia (IDA & IBRD)South SudanSpainSri LankaSt. Kitts and NevisSt. LuciaSt. Vincent and the GrenadinesSub-Saharan Africa Sub-Saharan Africa (excluding high income)Sub-Saharan Africa (IDA & IBRD countries)SudanSurinameSwazilandSwedenSwitzerlandSyrian Arab RepublicTajikistanTanzaniaThailandTimor-LesteTogoTongaTrinidad and TobagoTunisiaTurkeyTurkmenistanUgandaUkraineUnited Arab EmiratesUnited KingdomUnited StatesUpper middle incomeUruguayUzbekistanVanuatuVenezuela, RBVietnamWest Bank and GazaWorldYemen, Rep.ZambiaZimbabwe Linha do tempo:
Nesta escala de tempo está apresentado um gráfico de 1961 ano até 2016 ano Korea, Rep.. Dados de 1960 ano ausente. O número de observações reais por data: 56.
Fonte (nome):
Indicadores de desenvolvimento mundial
Fonte (organização):
World Bank national accounts data, and OECD National Accounts data files.
Categorias:
Economy & Growth
Foi atualizado:
23 abr 2017 ano
Indicadores de alterações dos valores ao longo dos anos
Mínimo:
11.439
1 jan 1961 ano
Máximo:
36.063
1 jan 1992 ano
Na data de observação
Valor
Mudança absoluta
A alteração em relação ao valor anterior
1 jan 1961 ano
11.439
+11.439
0.0%
1 jan 1962 ano
12.031
+0.592
5.18%
1 jan 1963 ano
14.287
+2.256
18.75%
1 jan 1964 ano
14.091
-0.196
-1.37%
1 jan 1965 ano
11.74
-2.351
-16.69%
1 jan 1966 ano
15.423
+3.683
31.38%
1 jan 1967 ano
21.194
+5.771
37.42%
1 jan 1968 ano
22.528
+1.334
6.29%
1 jan 1969 ano
26.188
+3.661
16.25%
1 jan 1970 ano
26.9
+0.712
2.72%
1 jan 1971 ano
24.176
-2.724
-10.13%
1 jan 1972 ano
21.73
-2.446
-10.12%
1 jan 1973 ano
20.039
-1.69
-7.78%
1 jan 1974 ano
22.77
+2.731
13.63%
1 jan 1975 ano
25.48
+2.709
11.9%
1 jan 1976 ano
25.295
-0.185
-0.73%
1 jan 1977 ano
24.072
-1.223
-4.84%
1 jan 1978 ano
26.824
+2.752
11.43%
1 jan 1979 ano
30.805
+3.981
14.84%
1 jan 1980 ano
31.885
+1.08
3.51%
1 jan 1981 ano
30.331
-1.554
-4.87%
1 jan 1982 ano
26.35
-3.981
-13.13%
1 jan 1983 ano
26.703
+0.353
1.34%
1 jan 1984 ano
27.56
+0.857
3.21%
1 jan 1985 ano
27.187
-0.372
-1.35%
1 jan 1986 ano
26.8
-0.387
-1.42%
1 jan 1987 ano
26.418
-0.382
-1.43%
1 jan 1988 ano
27.239
+0.82
3.11%
1 jan 1989 ano
27.658
+0.419
1.54%
1 jan 1990 ano
29.81
+2.152
7.78%
1 jan 1991 ano
34.352
+4.542
15.24%
1 jan 1992 ano
36.063
+1.711
4.98%
1 jan 1993 ano
34.173
-1.89
-5.24%
1 jan 1994 ano
33.572
-0.601
-1.76%
1 jan 1995 ano
33.618
+0.046
0.14%
1 jan 1996 ano
34.497
+0.879
2.61%
1 jan 1997 ano
34.642
+0.145
0.42%
1 jan 1998 ano
32.814
-1.827
-5.28%
1 jan 1999 ano
27.845
-4.969
-15.14%
1 jan 2000 ano
27.226
-0.618
-2.22%
1 jan 2001 ano
31.617
+4.39
16.13%
1 jan 2002 ano
30.674
-0.943
-2.98%
1 jan 2003 ano
30.385
-0.288
-0.94%
1 jan 2004 ano
31.25
+0.865
2.85%
1 jan 2005 ano
31.2
-0.05
-0.16%
1 jan 2006 ano
30.861
-0.339
-1.09%
1 jan 2007 ano
30.74
-0.121
-0.39%
1 jan 2008 ano
30.514
-0.227
-0.74%
1 jan 2009 ano
31.382
+0.868
2.84%
1 jan 2010 ano
31.318
-0.064
-0.2%
1 jan 2011 ano
30.5
-0.818
-2.61%
1 jan 2012 ano
30.243
-0.257
-0.84%
1 jan 2013 ano
29.569
-0.674
-2.23%
1 jan 2014 ano
29.262
-0.307
-1.04%
1 jan 2015 ano
29.155
-0.107
-0.37%
1 jan 2016 ano
29.083
-0.072
-0.25%
Classificação de países por estatísticas atuais por anos


Comentários: