29
/pt/
pt
AIzaSyAYiBZKx7MnpbEhh9jyipgxe19OcubqV5w
April 1, 2024
116946
Cyprus
CYP
true
2
1
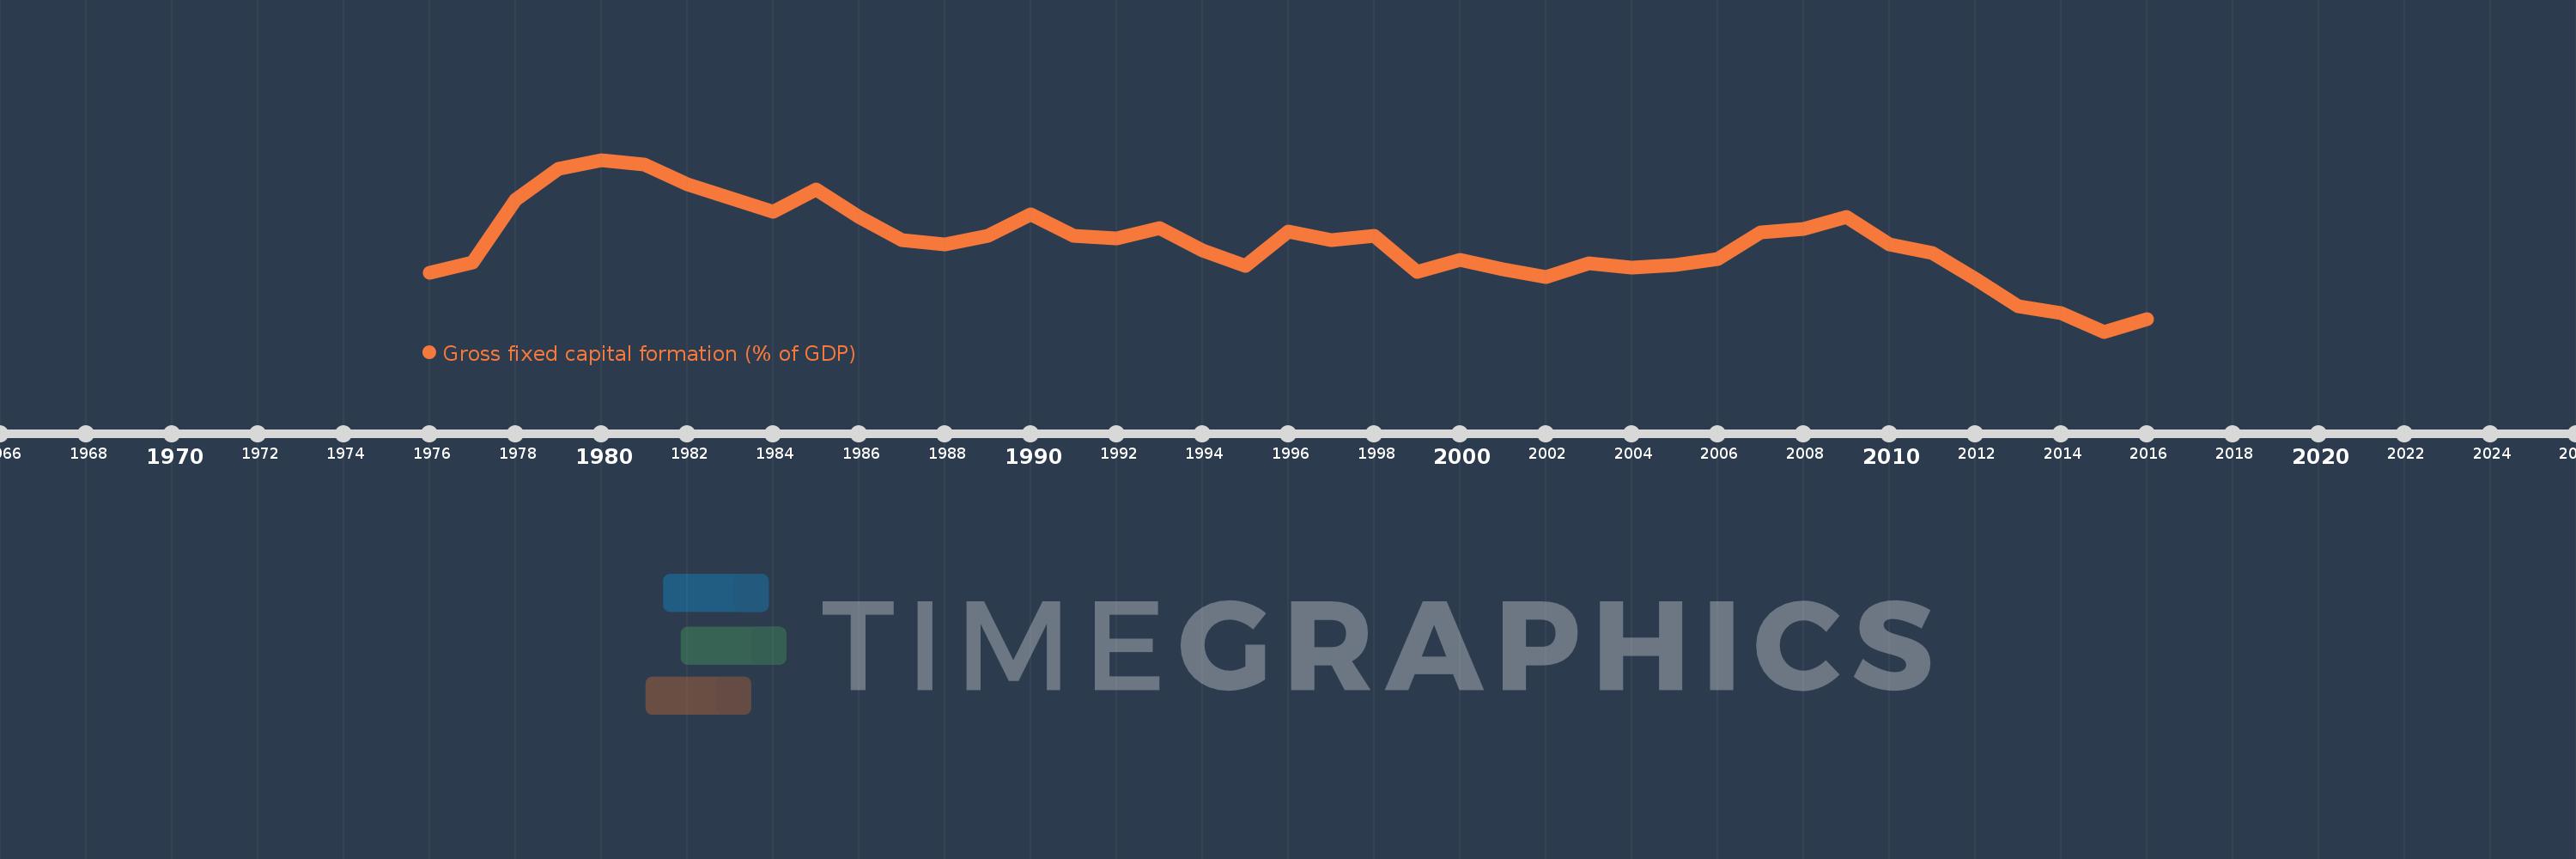
Gross fixed capital formation (% of GDP)
2016,2015,2014,2013,2012,2011,2010,2009,2008,2007,2006,2005,2004,2003,2002,2001,2000,1999,1998,1997,1996,1995,1994,1993,1992,1991,1990,1989,1988,1987,1986,1985,1984,1983,1982,1981,1980,1979,1978,1977,1976
Estas estatísticas em outros países:
AfghanistanAlbaniaAlgeriaAngolaAntigua and BarbudaArab WorldArgentinaArmeniaArubaAustraliaAustriaAzerbaijanBahamas, TheBahrainBangladeshBarbadosBelarusBelgiumBelizeBeninBermudaBhutanBoliviaBosnia and HerzegovinaBotswanaBrazilBrunei DarussalamBulgariaBurkina FasoBurundiCabo VerdeCambodiaCameroonCanadaCaribbean small statesCentral African RepublicCentral Europe and the BalticsChadChileChinaColombiaComorosCongo, Dem. Rep.Congo, Rep.Costa RicaCote d'IvoireCroatiaCubaCyprusCzech RepublicDenmarkDjiboutiDominicaDominican RepublicEarly-demographic dividendEast Asia & PacificEast Asia & Pacific (excluding high income)East Asia & Pacific (IDA & IBRD countries)EcuadorEgypt, Arab Rep.El SalvadorEquatorial GuineaEritreaEstoniaEthiopiaEuro areaEurope & Central AsiaEurope & Central Asia (excluding high income)Europe & Central Asia (IDA & IBRD countries)European UnionFijiFinlandFragile and conflict affected situationsFranceGabonGambia, TheGeorgiaGermanyGhanaGreeceGrenadaGuatemalaGuineaGuinea-BissauGuyanaHaitiHeavily indebted poor countries (HIPC)High incomeHondurasHong Kong SAR, ChinaHungaryIBRD onlyIcelandIDA & IBRD totalIDA blendIDA onlyIDA totalIndiaIndonesiaIran, Islamic Rep.IraqIrelandIsraelItalyJamaicaJapanJordanKazakhstanKenyaKiribatiKorea, Rep.KosovoKuwaitKyrgyz RepublicLao PDRLate-demographic dividendLatin America & Caribbean Latin America & Caribbean (excluding high income)Latin America & the Caribbean (IDA & IBRD countries)LatviaLeast developed countries: UN classificationLebanonLesothoLiberiaLibyaLithuaniaLow & middle incomeLow incomeLower middle incomeLuxembourgMacao SAR, ChinaMacedonia, FYRMadagascarMalawiMalaysiaMaldivesMaliMaltaMauritaniaMauritiusMexicoMicronesia, Fed. Sts.Middle East & North AfricaMiddle East & North Africa (excluding high income)Middle East & North Africa (IDA & IBRD countries)Middle incomeMoldovaMongoliaMontenegroMoroccoMozambiqueNamibiaNepalNetherlandsNew CaledoniaNew ZealandNicaraguaNigerNigeriaNorth AmericaNorwayOECD membersOmanPacific island small statesPakistanPanamaPapua New GuineaParaguayPeruPhilippinesPolandPortugalPost-demographic dividendPre-demographic dividendPuerto RicoRomaniaRussian FederationRwandaSaudi ArabiaSenegalSerbiaSeychellesSierra LeoneSingaporeSlovak RepublicSloveniaSolomon IslandsSomaliaSouth AfricaSouth AsiaSouth Asia (IDA & IBRD)South SudanSpainSri LankaSt. Kitts and NevisSt. LuciaSt. Vincent and the GrenadinesSub-Saharan Africa Sub-Saharan Africa (excluding high income)Sub-Saharan Africa (IDA & IBRD countries)SudanSurinameSwazilandSwedenSwitzerlandSyrian Arab RepublicTajikistanTanzaniaThailandTimor-LesteTogoTongaTrinidad and TobagoTunisiaTurkeyTurkmenistanUgandaUkraineUnited Arab EmiratesUnited KingdomUnited StatesUpper middle incomeUruguayUzbekistanVanuatuVenezuela, RBVietnamWest Bank and GazaWorldYemen, Rep.ZambiaZimbabwe Linha do tempo:
Nesta escala de tempo está apresentado um gráfico de 1976 ano até 2016 ano Cyprus. Dados de 1975 ano ausente. O número de observações reais por data: 41.
Fonte (nome):
Indicadores de desenvolvimento mundial
Fonte (organização):
World Bank national accounts data, and OECD National Accounts data files.
Categorias:
Economy & Growth
Foi atualizado:
23 abr 2017 ano
Indicadores de alterações dos valores ao longo dos anos
Mínimo:
11.683
1 jan 2015 ano
Máximo:
34.852
1 jan 1980 ano
Na data de observação
Valor
Mudança absoluta
A alteração em relação ao valor anterior
1 jan 1976 ano
19.65
+19.65
0.0%
1 jan 1977 ano
21.054
+1.404
7.15%
1 jan 1978 ano
29.449
+8.395
39.87%
1 jan 1979 ano
33.643
+4.193
14.24%
1 jan 1980 ano
34.852
+1.21
3.6%
1 jan 1981 ano
34.197
-0.655
-1.88%
1 jan 1982 ano
31.495
-2.702
-7.9%
1 jan 1983 ano
29.73
-1.766
-5.61%
1 jan 1984 ano
27.8
-1.93
-6.49%
1 jan 1985 ano
30.843
+3.044
10.95%
1 jan 1986 ano
27.189
-3.654
-11.85%
1 jan 1987 ano
23.987
-3.203
-11.78%
1 jan 1988 ano
23.475
-0.512
-2.13%
1 jan 1989 ano
24.59
+1.116
4.75%
1 jan 1990 ano
27.533
+2.943
11.97%
1 jan 1991 ano
24.608
-2.926
-10.63%
1 jan 1992 ano
24.309
-0.298
-1.21%
1 jan 1993 ano
25.65
+1.341
5.52%
1 jan 1994 ano
22.634
-3.016
-11.76%
1 jan 1995 ano
20.585
-2.049
-9.05%
1 jan 1996 ano
25.201
+4.616
22.42%
1 jan 1997 ano
24.072
-1.129
-4.48%
1 jan 1998 ano
24.555
+0.483
2.01%
1 jan 1999 ano
19.681
-4.874
-19.85%
1 jan 2000 ano
21.339
+1.658
8.43%
1 jan 2001 ano
20.084
-1.255
-5.88%
1 jan 2002 ano
19.022
-1.062
-5.29%
1 jan 2003 ano
20.948
+1.926
10.12%
1 jan 2004 ano
20.286
-0.662
-3.16%
1 jan 2005 ano
20.646
+0.36
1.77%
1 jan 2006 ano
21.527
+0.881
4.27%
1 jan 2007 ano
25.078
+3.551
16.49%
1 jan 2008 ano
25.548
+0.471
1.88%
1 jan 2009 ano
27.188
+1.64
6.42%
1 jan 2010 ano
23.442
-3.746
-13.78%
1 jan 2011 ano
22.259
-1.183
-5.05%
1 jan 2012 ano
18.851
-3.408
-15.31%
1 jan 2013 ano
15.079
-3.772
-20.01%
1 jan 2014 ano
14.143
-0.937
-6.21%
1 jan 2015 ano
11.683
-2.46
-17.39%
1 jan 2016 ano
13.309
+1.626
13.92%
Classificação de países por estatísticas atuais por anos


Comentários: