29
/pt/
pt
AIzaSyAYiBZKx7MnpbEhh9jyipgxe19OcubqV5w
April 1, 2024
198449
Moldova
MDA
true
2
1
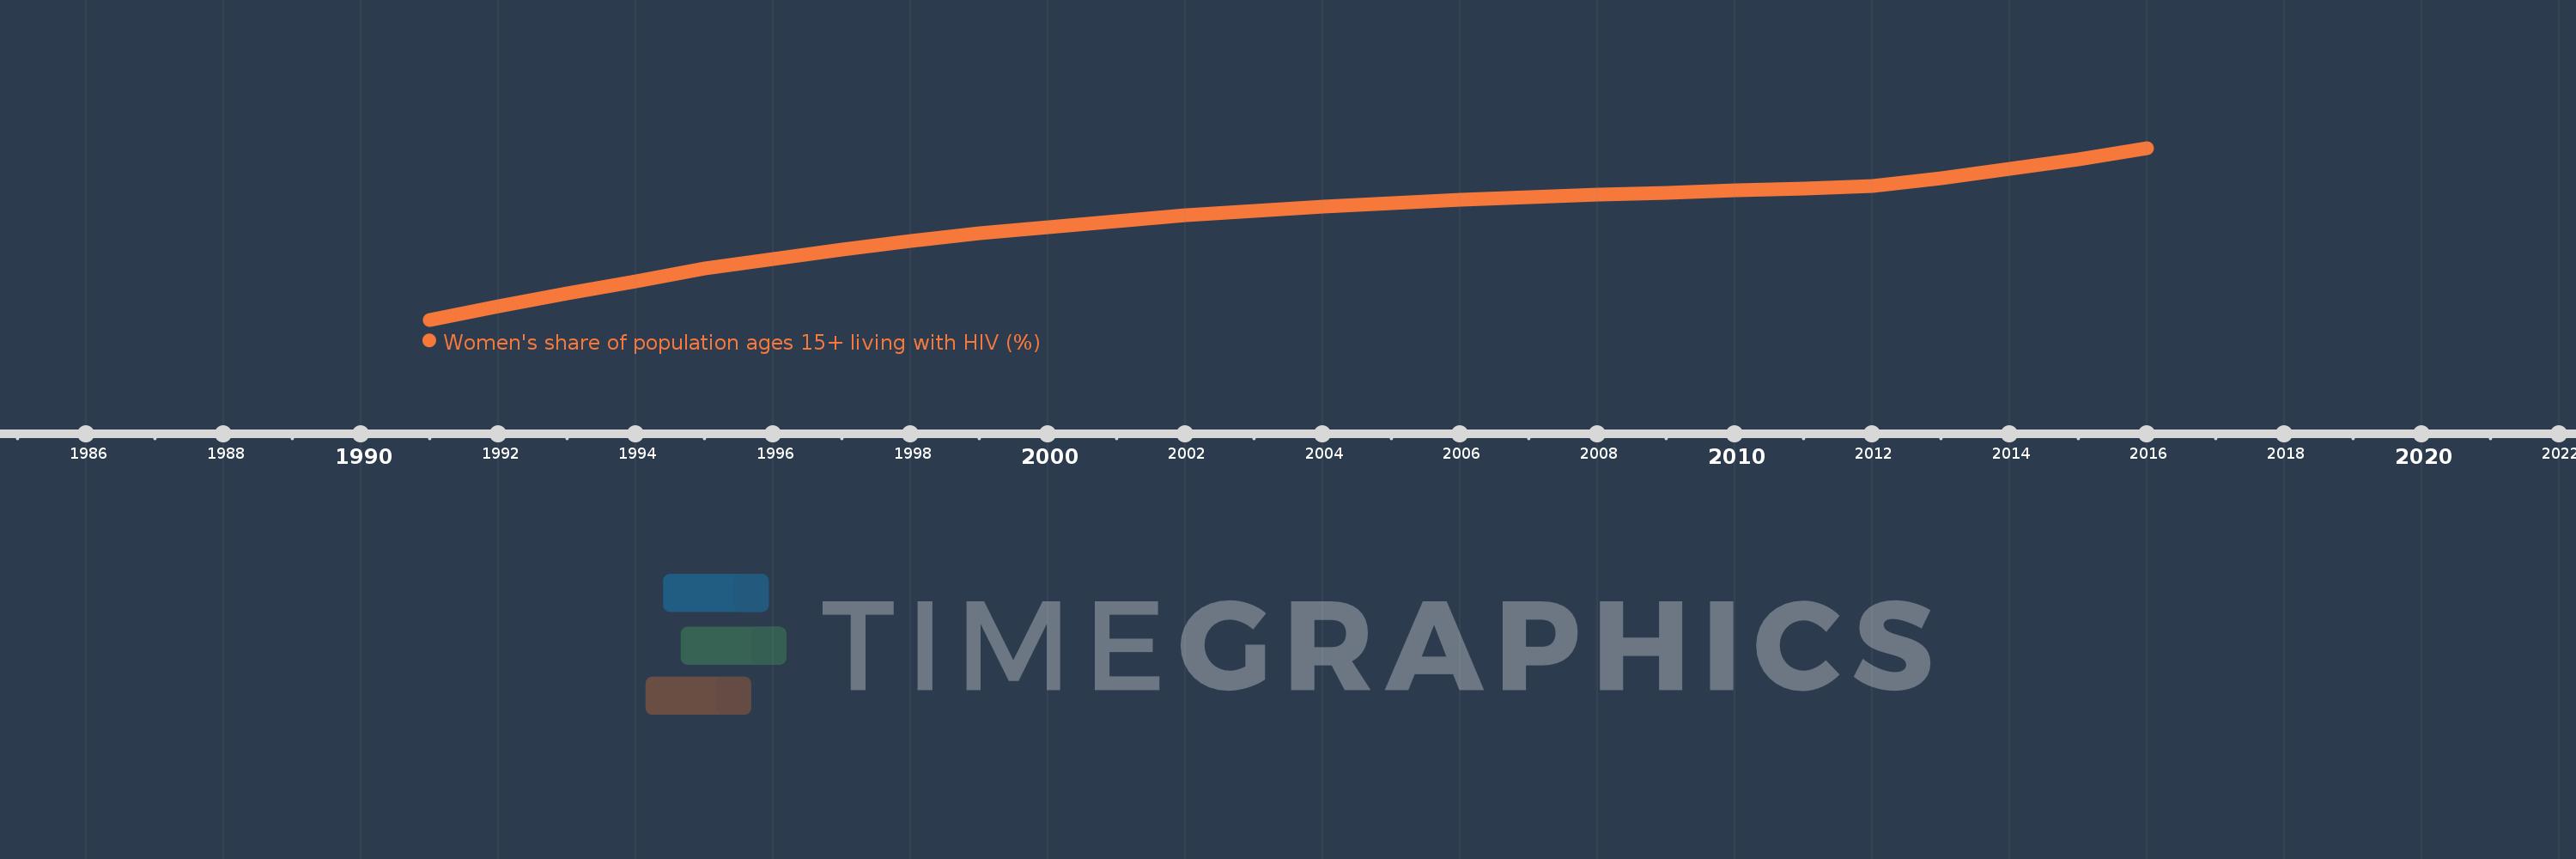
Women's share of population ages 15+ living with HIV (%)
2016,2015,2014,2013,2012,2011,2010,2009,2008,2007,2006,2005,2004,2003,2002,2001,2000,1999,1998,1997,1996,1995,1994,1993,1992,1991
Estas estatísticas em outros países:
Linha do tempo:
Nesta escala de tempo está apresentado um gráfico de 1991 ano até 2016 ano Moldova. Dados de 1990 ano ausente. O número de observações reais por data: 26.
Fonte (nome):
Indicadores de desenvolvimento mundial
Fonte (organização):
UNAIDS estimates.
Categorias:
Health, Gender
Foi atualizado:
23 abr 2017 ano
Indicadores de alterações dos valores ao longo dos anos
Mínimo:
24.254
1 jan 1991 ano
Máximo:
32.041
1 jan 2016 ano
Na data de observação
Valor
Mudança absoluta
A alteração em relação ao valor anterior
1 jan 1991 ano
24.254
+24.254
0.0%
1 jan 1992 ano
24.876
+0.622
2.56%
1 jan 1993 ano
25.455
+0.579
2.33%
1 jan 1994 ano
25.991
+0.536
2.11%
1 jan 1995 ano
26.574
+0.583
2.24%
1 jan 1996 ano
27.013
+0.439
1.65%
1 jan 1997 ano
27.447
+0.434
1.61%
1 jan 1998 ano
27.83
+0.382
1.39%
1 jan 1999 ano
28.158
+0.328
1.18%
1 jan 2000 ano
28.46
+0.303
1.07%
1 jan 2001 ano
28.734
+0.273
0.96%
1 jan 2002 ano
28.977
+0.243
0.85%
1 jan 2003 ano
29.189
+0.212
0.73%
1 jan 2004 ano
29.379
+0.19
0.65%
1 jan 2005 ano
29.545
+0.166
0.57%
1 jan 2006 ano
29.695
+0.15
0.51%
1 jan 2007 ano
29.818
+0.123
0.41%
1 jan 2008 ano
29.921
+0.103
0.35%
1 jan 2009 ano
30.02
+0.099
0.33%
1 jan 2010 ano
30.104
+0.083
0.28%
1 jan 2011 ano
30.2
+0.097
0.32%
1 jan 2012 ano
30.333
+0.132
0.44%
1 jan 2013 ano
30.667
+0.334
1.1%
1 jan 2014 ano
31.084
+0.417
1.36%
1 jan 2015 ano
31.516
+0.432
1.39%
1 jan 2016 ano
32.041
+0.524
1.66%
Classificação de países por estatísticas atuais por anos


Comentários: