29
/pt/
pt
AIzaSyAYiBZKx7MnpbEhh9jyipgxe19OcubqV5w
April 1, 2024
116344
Cuba
CUB
true
2
1
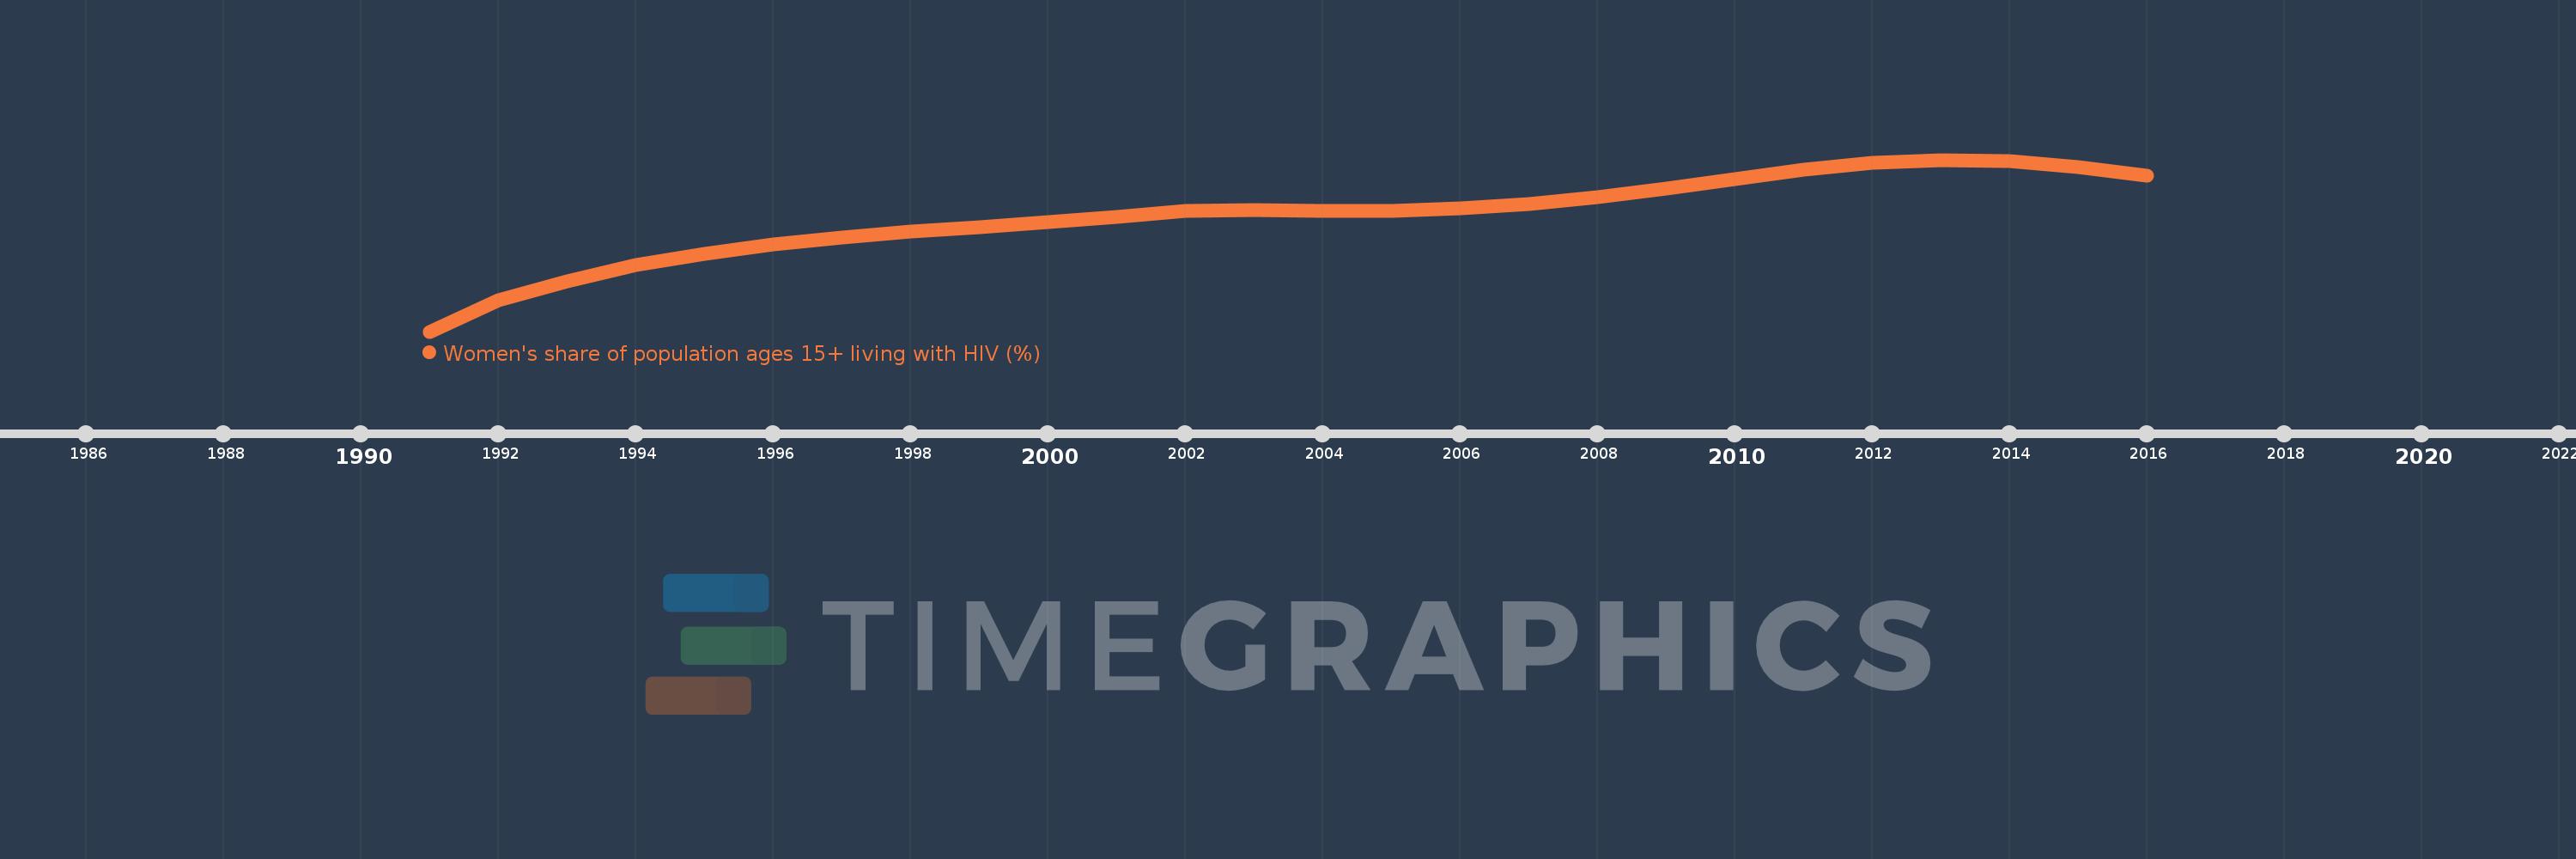
Women's share of population ages 15+ living with HIV (%)
2016,2015,2014,2013,2012,2011,2010,2009,2008,2007,2006,2005,2004,2003,2002,2001,2000,1999,1998,1997,1996,1995,1994,1993,1992,1991
Estas estatísticas em outros países:
Linha do tempo:
Nesta escala de tempo está apresentado um gráfico de 1991 ano até 2016 ano Cuba. Dados de 1990 ano ausente. O número de observações reais por data: 26.
Fonte (nome):
Indicadores de desenvolvimento mundial
Fonte (organização):
UNAIDS estimates.
Categorias:
Health, Gender
Foi atualizado:
23 abr 2017 ano
Indicadores de alterações dos valores ao longo dos anos
Mínimo:
17.469
1 jan 1991 ano
Máximo:
26.34
1 jan 2013 ano
Na data de observação
Valor
Mudança absoluta
A alteração em relação ao valor anterior
1 jan 1991 ano
17.469
+17.469
0.0%
1 jan 1992 ano
19.084
+1.615
9.25%
1 jan 1993 ano
20.079
+0.995
5.21%
1 jan 1994 ano
20.904
+0.825
4.11%
1 jan 1995 ano
21.484
+0.58
2.78%
1 jan 1996 ano
21.959
+0.475
2.21%
1 jan 1997 ano
22.328
+0.369
1.68%
1 jan 1998 ano
22.632
+0.304
1.36%
1 jan 1999 ano
22.873
+0.241
1.06%
1 jan 2000 ano
23.14
+0.267
1.17%
1 jan 2001 ano
23.382
+0.242
1.05%
1 jan 2002 ano
23.682
+0.3
1.28%
1 jan 2003 ano
23.748
+0.066
0.28%
1 jan 2004 ano
23.684
-0.065
-0.27%
1 jan 2005 ano
23.722
+0.038
0.16%
1 jan 2006 ano
23.83
+0.108
0.45%
1 jan 2007 ano
24.066
+0.237
0.99%
1 jan 2008 ano
24.412
+0.346
1.44%
1 jan 2009 ano
24.857
+0.445
1.82%
1 jan 2010 ano
25.334
+0.477
1.92%
1 jan 2011 ano
25.81
+0.476
1.88%
1 jan 2012 ano
26.165
+0.356
1.38%
1 jan 2013 ano
26.34
+0.175
0.67%
1 jan 2014 ano
26.289
-0.052
-0.2%
1 jan 2015 ano
25.98
-0.309
-1.17%
1 jan 2016 ano
25.536
-0.443
-1.71%
Classificação de países por estatísticas atuais por anos


Comentários: