29
/pt/
pt
AIzaSyAYiBZKx7MnpbEhh9jyipgxe19OcubqV5w
April 1, 2024
64228
Afghanistan
AFG
true
2
1
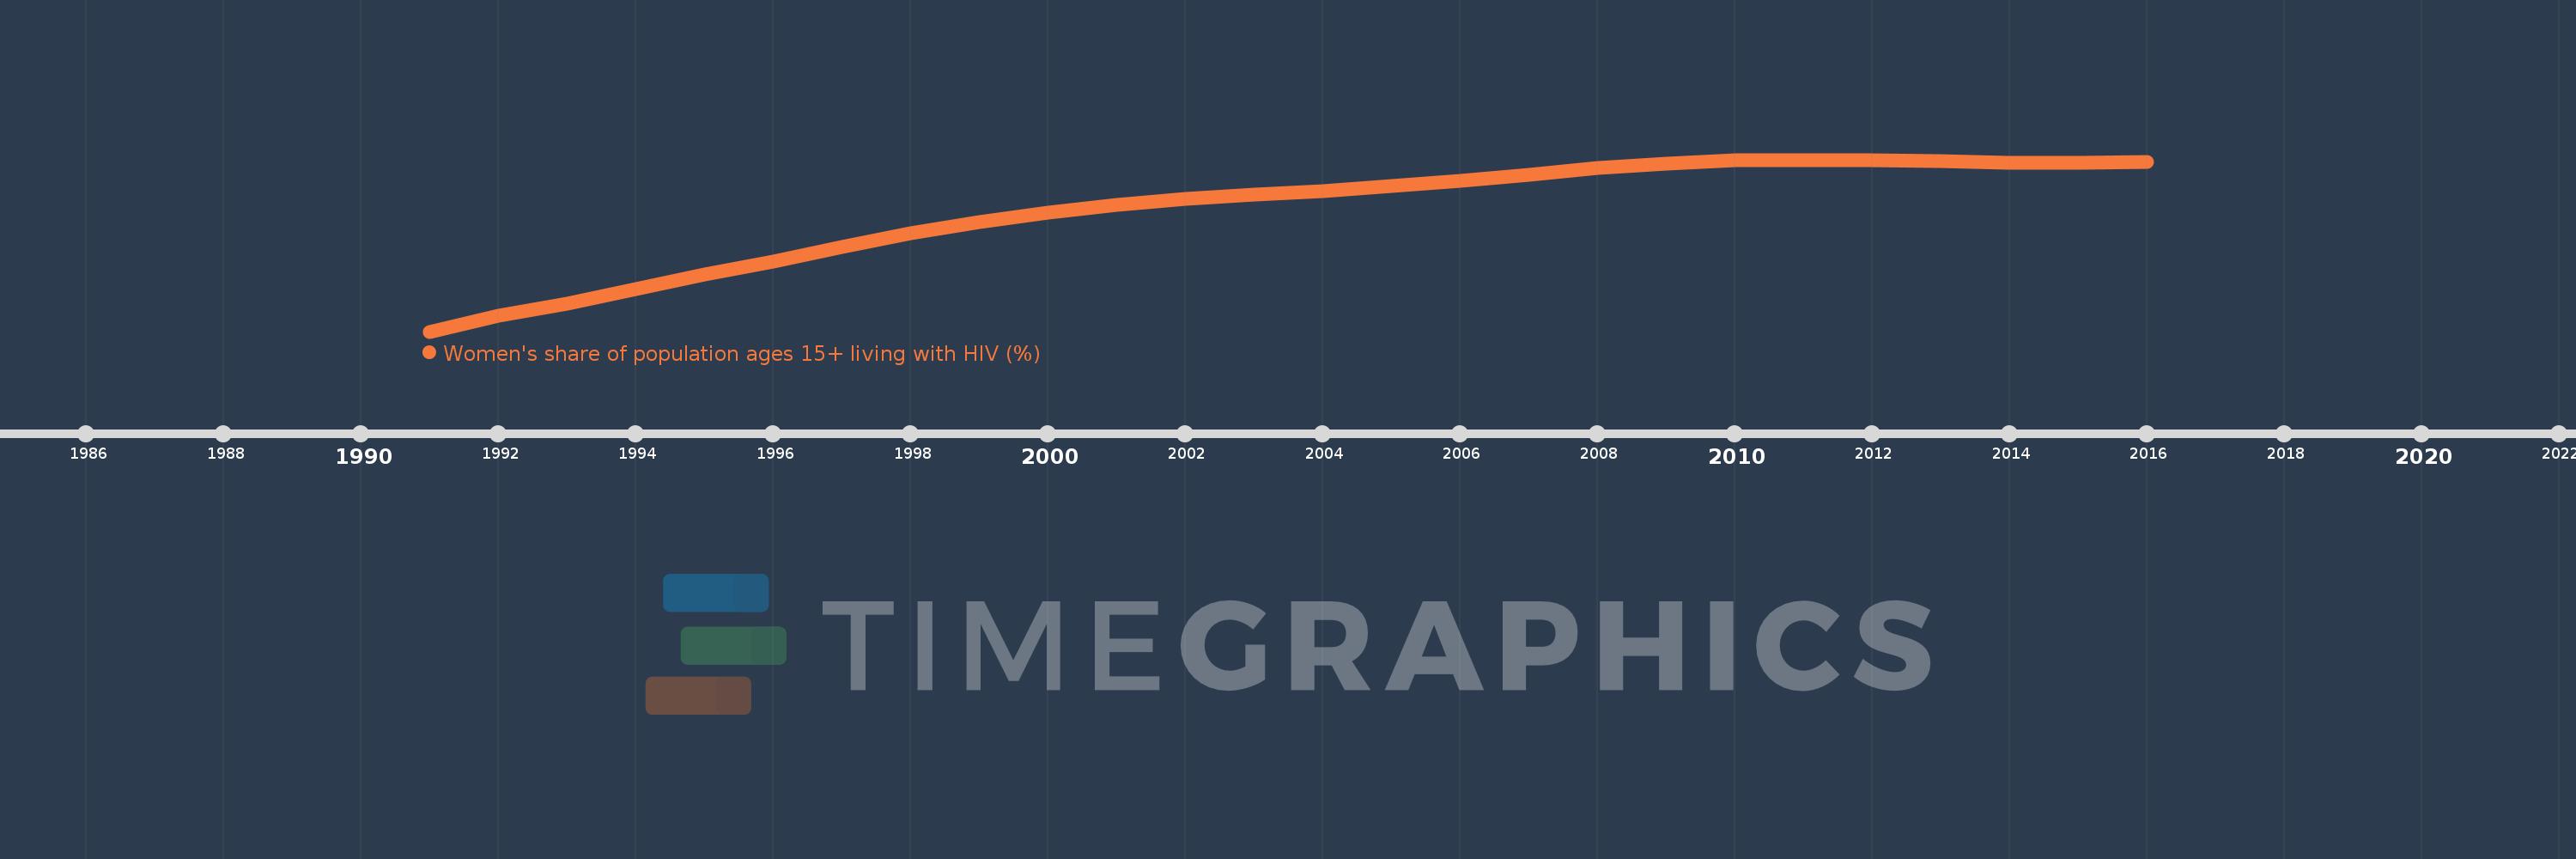
Women's share of population ages 15+ living with HIV (%)
2016,2015,2014,2013,2012,2011,2010,2009,2008,2007,2006,2005,2004,2003,2002,2001,2000,1999,1998,1997,1996,1995,1994,1993,1992,1991
Estas estatísticas em outros países:
Linha do tempo:
Nesta escala de tempo está apresentado um gráfico de 1991 ano até 2016 ano Afghanistan. Dados de 1990 ano ausente. O número de observações reais por data: 26.
Fonte (nome):
Indicadores de desenvolvimento mundial
Fonte (organização):
UNAIDS estimates.
Categorias:
Health, Gender
Foi atualizado:
23 abr 2017 ano
Indicadores de alterações dos valores ao longo dos anos
Mínimo:
23.099
1 jan 1991 ano
Máximo:
28.634
1 jan 2011 ano
Na data de observação
Valor
Mudança absoluta
A alteração em relação ao valor anterior
1 jan 1991 ano
23.099
+23.099
0.0%
1 jan 1992 ano
23.605
+0.507
2.19%
1 jan 1993 ano
24.0
+0.395
1.67%
1 jan 1994 ano
24.468
+0.468
1.95%
1 jan 1995 ano
24.945
+0.477
1.95%
1 jan 1996 ano
25.351
+0.405
1.63%
1 jan 1997 ano
25.833
+0.482
1.9%
1 jan 1998 ano
26.278
+0.445
1.72%
1 jan 1999 ano
26.64
+0.362
1.38%
1 jan 2000 ano
26.942
+0.302
1.13%
1 jan 2001 ano
27.183
+0.241
0.89%
1 jan 2002 ano
27.381
+0.198
0.73%
1 jan 2003 ano
27.512
+0.131
0.48%
1 jan 2004 ano
27.632
+0.12
0.44%
1 jan 2005 ano
27.786
+0.154
0.56%
1 jan 2006 ano
27.964
+0.178
0.64%
1 jan 2007 ano
28.149
+0.185
0.66%
1 jan 2008 ano
28.362
+0.213
0.76%
1 jan 2009 ano
28.509
+0.148
0.52%
1 jan 2010 ano
28.607
+0.098
0.34%
1 jan 2011 ano
28.634
+0.027
0.09%
1 jan 2012 ano
28.626
-0.008
-0.03%
1 jan 2013 ano
28.591
-0.035
-0.12%
1 jan 2014 ano
28.539
-0.052
-0.18%
1 jan 2015 ano
28.532
-0.006
-0.02%
1 jan 2016 ano
28.576
+0.044
0.15%
Classificação de países por estatísticas atuais por anos


Comentários: