29
/pt/
pt
AIzaSyAYiBZKx7MnpbEhh9jyipgxe19OcubqV5w
April 1, 2024
219233
Panama
PAN
true
2
1
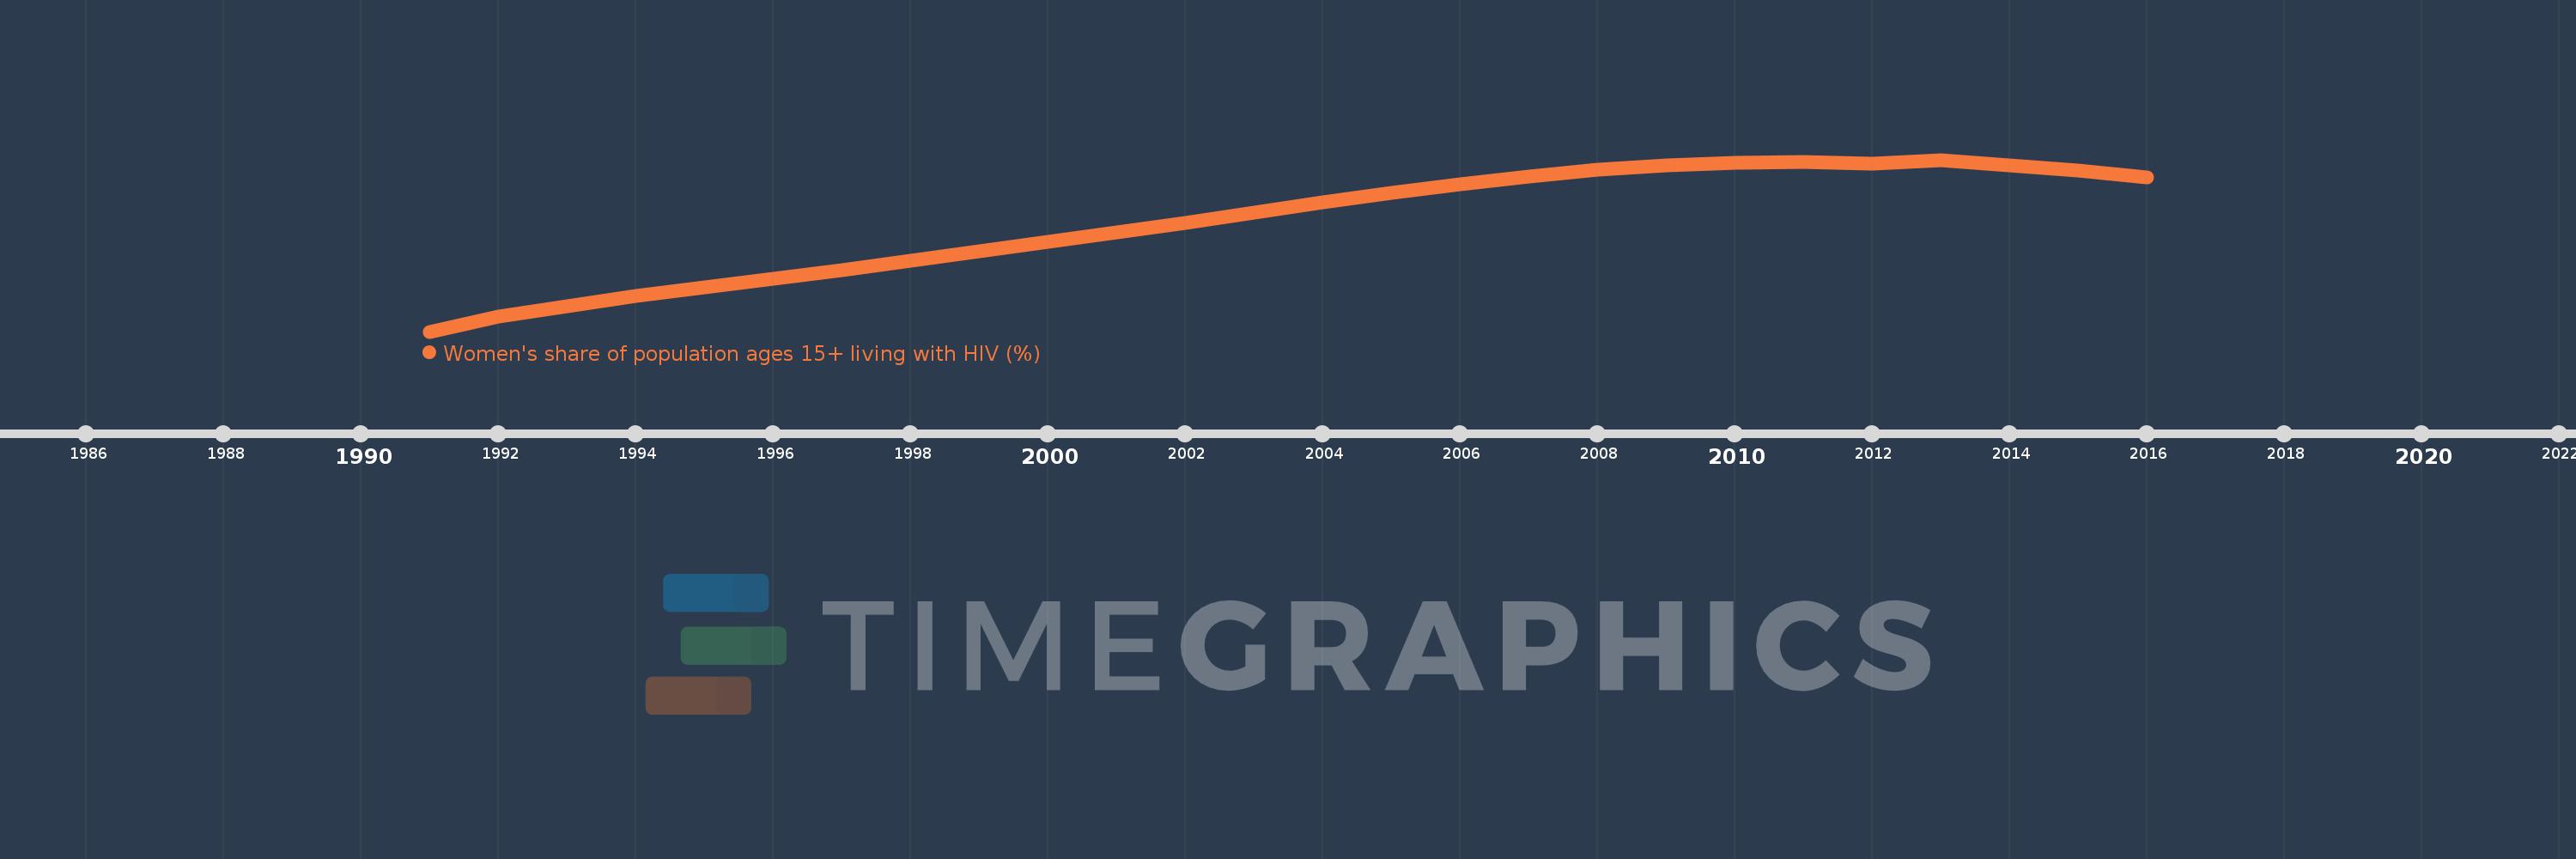
Women's share of population ages 15+ living with HIV (%)
2016,2015,2014,2013,2012,2011,2010,2009,2008,2007,2006,2005,2004,2003,2002,2001,2000,1999,1998,1997,1996,1995,1994,1993,1992,1991
Estas estatísticas em outros países:
Linha do tempo:
Nesta escala de tempo está apresentado um gráfico de 1991 ano até 2016 ano Panama. Dados de 1990 ano ausente. O número de observações reais por data: 26.
Fonte (nome):
Indicadores de desenvolvimento mundial
Fonte (organização):
UNAIDS estimates.
Categorias:
Health, Gender
Foi atualizado:
23 abr 2017 ano
Indicadores de alterações dos valores ao longo dos anos
Mínimo:
28.54
1 jan 1991 ano
Máximo:
30.651
1 jan 2013 ano
Na data de observação
Valor
Mudança absoluta
A alteração em relação ao valor anterior
1 jan 1991 ano
28.54
+28.54
0.0%
1 jan 1992 ano
28.722
+0.183
0.64%
1 jan 1993 ano
28.849
+0.127
0.44%
1 jan 1994 ano
28.982
+0.132
0.46%
1 jan 1995 ano
29.086
+0.105
0.36%
1 jan 1996 ano
29.186
+0.1
0.34%
1 jan 1997 ano
29.295
+0.109
0.37%
1 jan 1998 ano
29.412
+0.117
0.4%
1 jan 1999 ano
29.529
+0.117
0.4%
1 jan 2000 ano
29.647
+0.118
0.4%
1 jan 2001 ano
29.755
+0.108
0.37%
1 jan 2002 ano
29.87
+0.114
0.38%
1 jan 2003 ano
30.0
+0.13
0.44%
1 jan 2004 ano
30.129
+0.129
0.43%
1 jan 2005 ano
30.247
+0.118
0.39%
1 jan 2006 ano
30.352
+0.106
0.35%
1 jan 2007 ano
30.448
+0.096
0.32%
1 jan 2008 ano
30.525
+0.077
0.25%
1 jan 2009 ano
30.578
+0.053
0.17%
1 jan 2010 ano
30.614
+0.036
0.12%
1 jan 2011 ano
30.622
+0.008
0.03%
1 jan 2012 ano
30.599
-0.023
-0.08%
1 jan 2013 ano
30.651
+0.052
0.17%
1 jan 2014 ano
30.578
-0.074
-0.24%
1 jan 2015 ano
30.516
-0.062
-0.2%
1 jan 2016 ano
30.436
-0.08
-0.26%
Classificação de países por estatísticas atuais por anos


Comentários: