29
/pt/
pt
AIzaSyAYiBZKx7MnpbEhh9jyipgxe19OcubqV5w
April 1, 2024
141290
Ghana
GHA
true
2
1
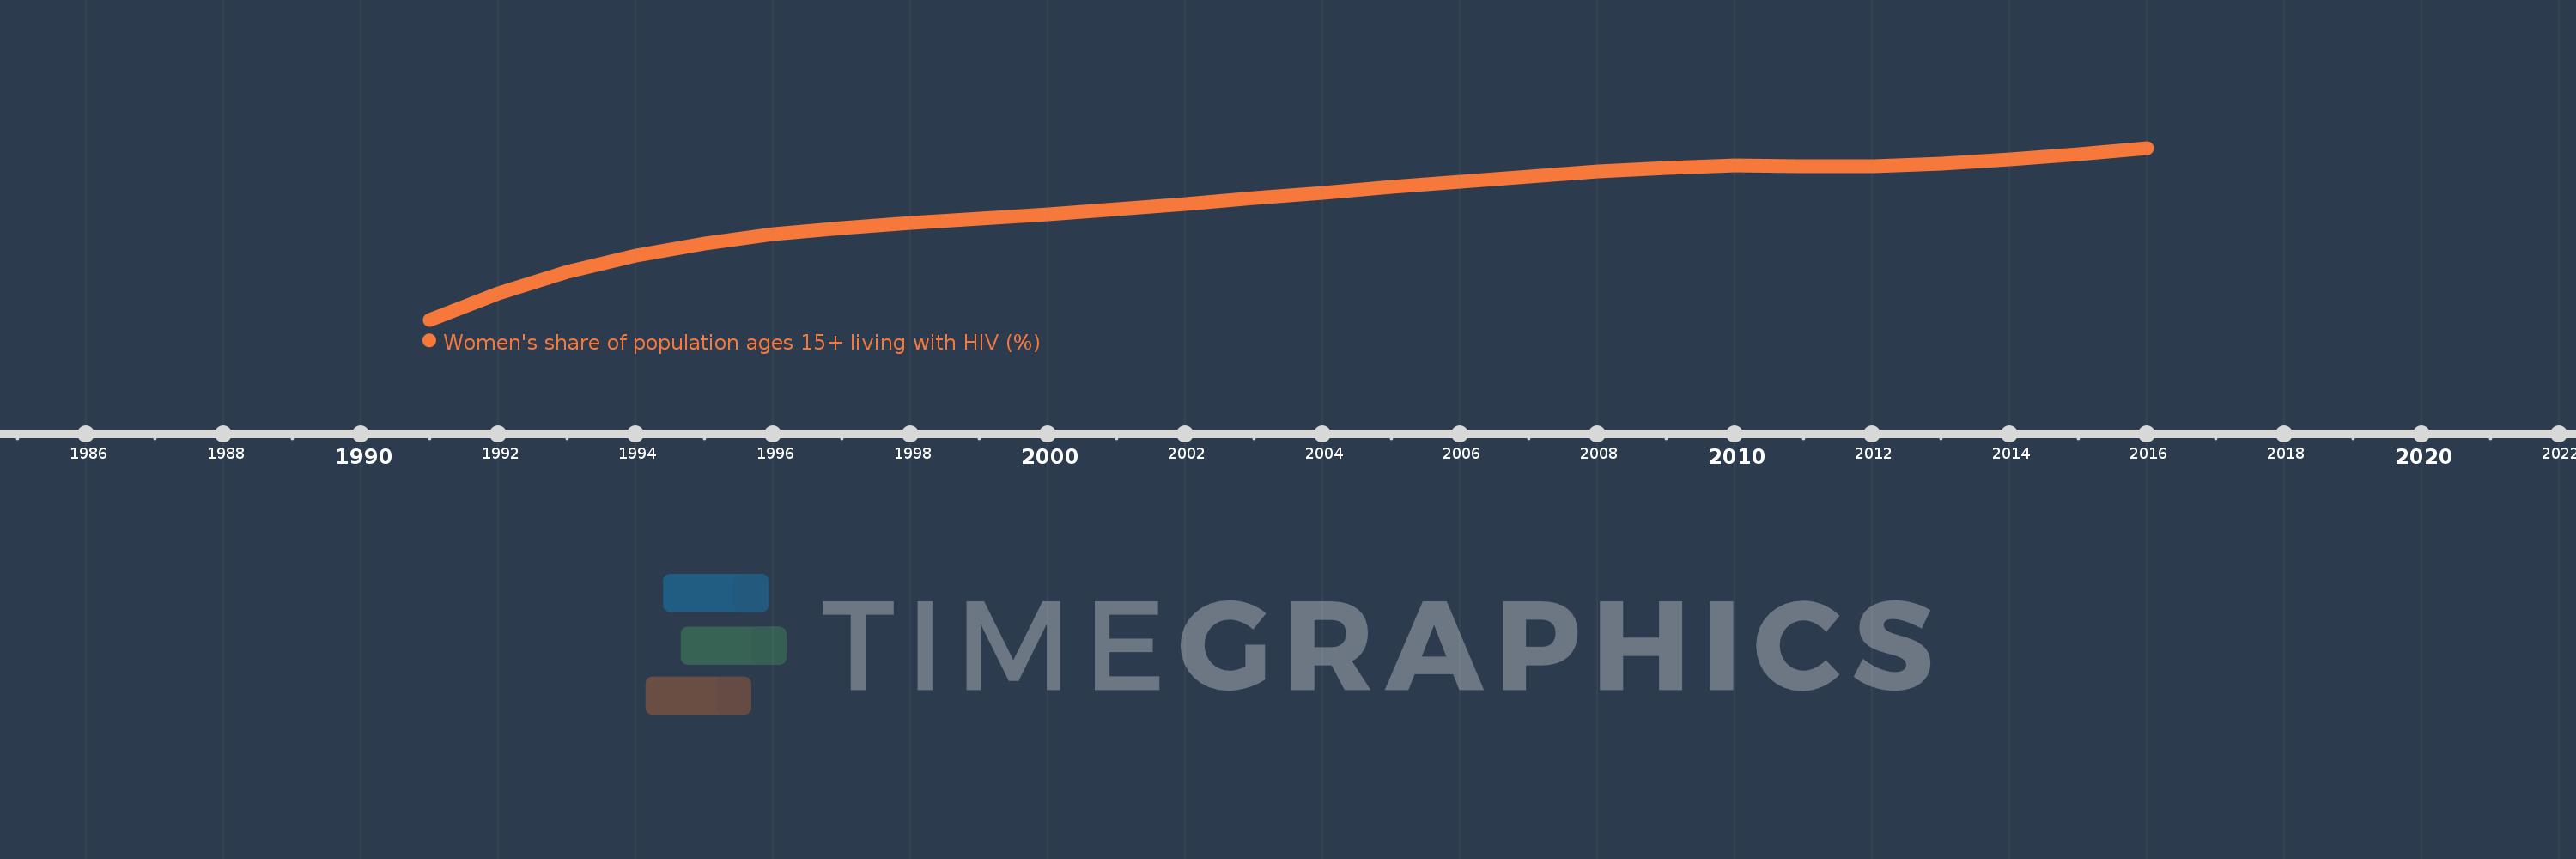
Women's share of population ages 15+ living with HIV (%)
2016,2015,2014,2013,2012,2011,2010,2009,2008,2007,2006,2005,2004,2003,2002,2001,2000,1999,1998,1997,1996,1995,1994,1993,1992,1991
Estas estatísticas em outros países:
Linha do tempo:
Nesta escala de tempo está apresentado um gráfico de 1991 ano até 2016 ano Ghana. Dados de 1990 ano ausente. O número de observações reais por data: 26.
Fonte (nome):
Indicadores de desenvolvimento mundial
Fonte (organização):
UNAIDS estimates.
Categorias:
Health, Gender
Foi atualizado:
23 abr 2017 ano
Indicadores de alterações dos valores ao longo dos anos
Mínimo:
51.874
1 jan 1991 ano
Máximo:
60.435
1 jan 2016 ano
Na data de observação
Valor
Mudança absoluta
A alteração em relação ao valor anterior
1 jan 1991 ano
51.874
+51.874
0.0%
1 jan 1992 ano
53.205
+1.331
2.57%
1 jan 1993 ano
54.264
+1.059
1.99%
1 jan 1994 ano
55.074
+0.81
1.49%
1 jan 1995 ano
55.679
+0.605
1.1%
1 jan 1996 ano
56.129
+0.449
0.81%
1 jan 1997 ano
56.454
+0.326
0.58%
1 jan 1998 ano
56.704
+0.25
0.44%
1 jan 1999 ano
56.928
+0.224
0.39%
1 jan 2000 ano
57.147
+0.219
0.38%
1 jan 2001 ano
57.395
+0.248
0.43%
1 jan 2002 ano
57.659
+0.264
0.46%
1 jan 2003 ano
57.93
+0.271
0.47%
1 jan 2004 ano
58.205
+0.275
0.47%
1 jan 2005 ano
58.481
+0.276
0.48%
1 jan 2006 ano
58.76
+0.279
0.48%
1 jan 2007 ano
59.025
+0.265
0.45%
1 jan 2008 ano
59.264
+0.239
0.4%
1 jan 2009 ano
59.446
+0.182
0.31%
1 jan 2010 ano
59.55
+0.104
0.18%
1 jan 2011 ano
59.536
-0.015
-0.02%
1 jan 2012 ano
59.508
-0.028
-0.05%
1 jan 2013 ano
59.633
+0.126
0.21%
1 jan 2014 ano
59.858
+0.225
0.38%
1 jan 2015 ano
60.127
+0.269
0.45%
1 jan 2016 ano
60.435
+0.308
0.51%
Classificação de países por estatísticas atuais por anos


Comentários: