29
/pt/
pt
AIzaSyAYiBZKx7MnpbEhh9jyipgxe19OcubqV5w
April 1, 2024
84940
Benin
BEN
true
2
1
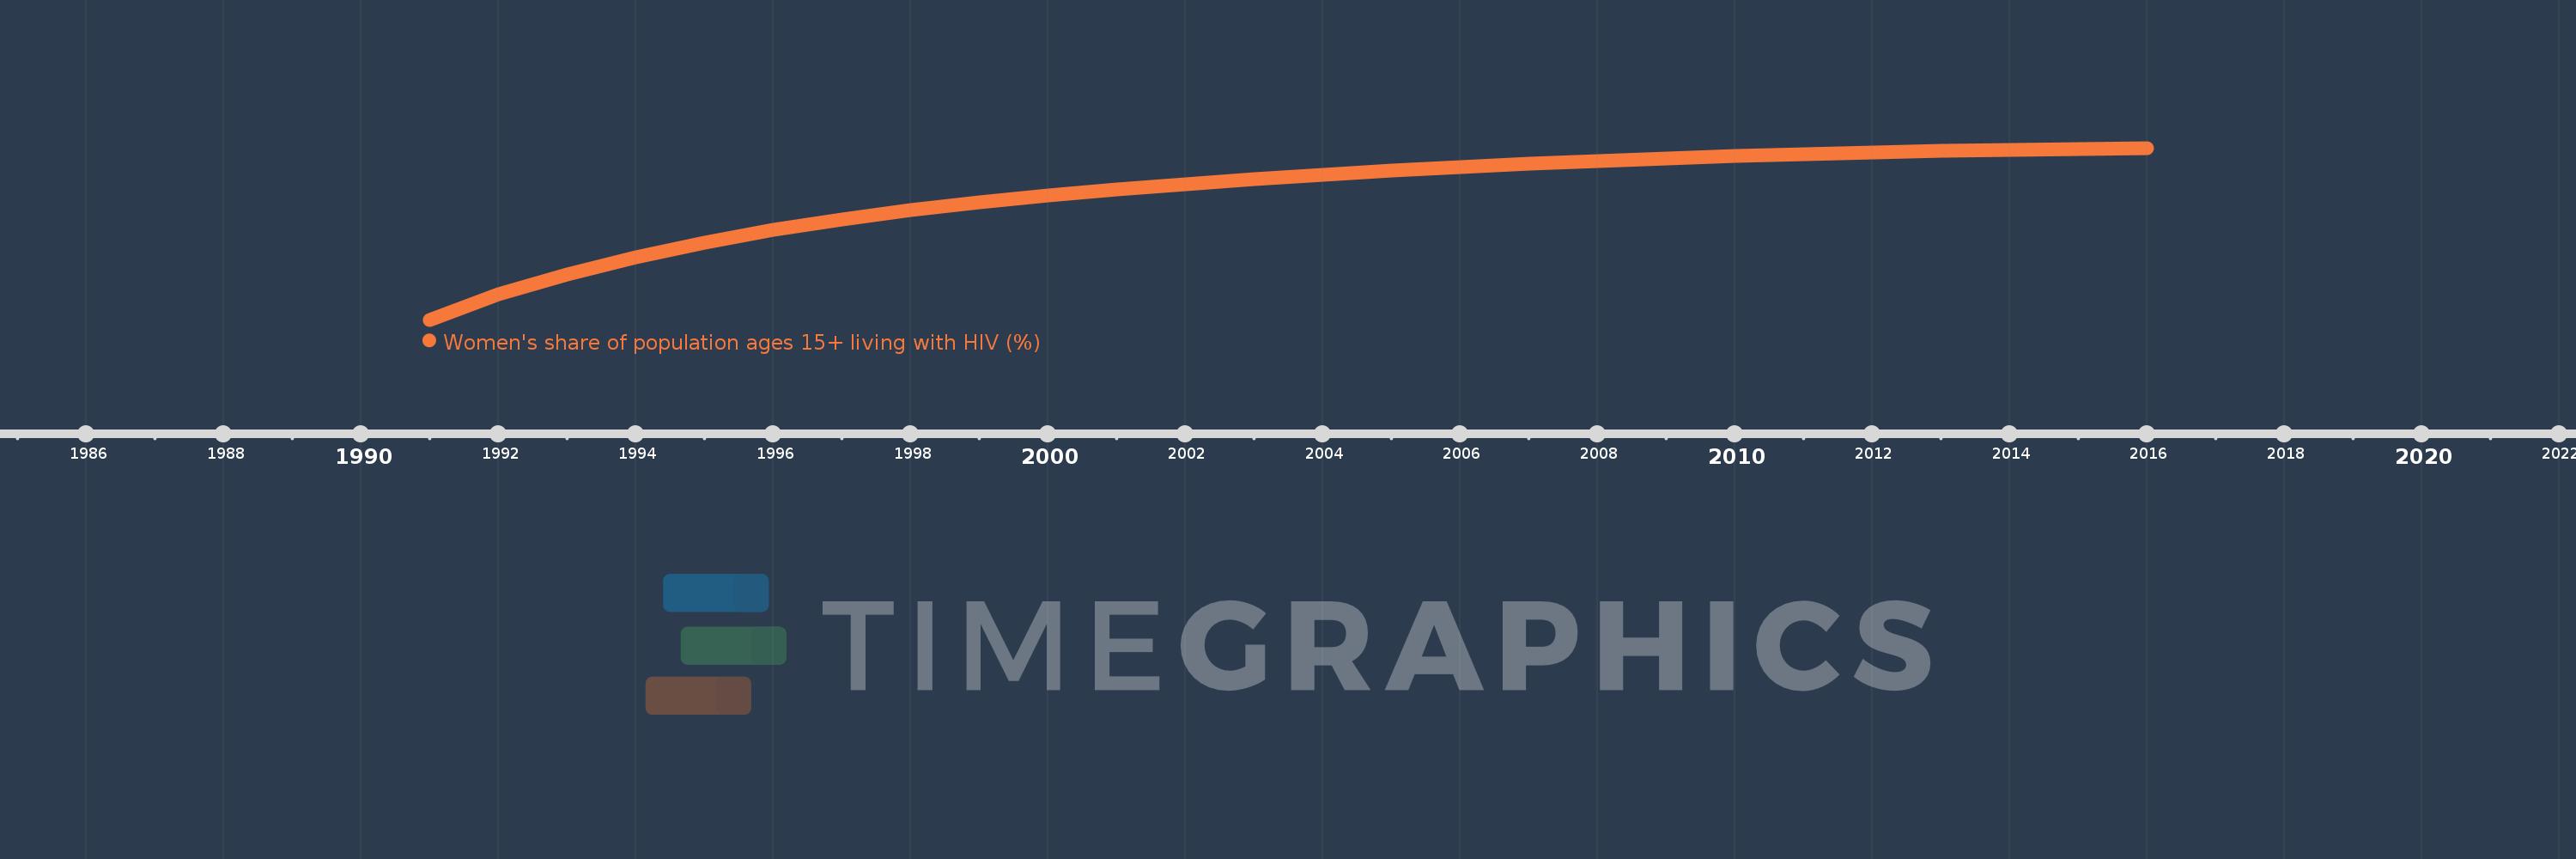
Women's share of population ages 15+ living with HIV (%)
2016,2015,2014,2013,2012,2011,2010,2009,2008,2007,2006,2005,2004,2003,2002,2001,2000,1999,1998,1997,1996,1995,1994,1993,1992,1991
Estas estatísticas em outros países:
Linha do tempo:
Nesta escala de tempo está apresentado um gráfico de 1991 ano até 2016 ano Benin. Dados de 1990 ano ausente. O número de observações reais por data: 26.
Fonte (nome):
Indicadores de desenvolvimento mundial
Fonte (organização):
UNAIDS estimates.
Categorias:
Health, Gender
Foi atualizado:
23 abr 2017 ano
Indicadores de alterações dos valores ao longo dos anos
Mínimo:
39.604
1 jan 1991 ano
Máximo:
58.413
1 jan 2016 ano
Na data de observação
Valor
Mudança absoluta
A alteração em relação ao valor anterior
1 jan 1991 ano
39.604
+39.604
0.0%
1 jan 1992 ano
42.351
+2.747
6.94%
1 jan 1993 ano
44.581
+2.23
5.27%
1 jan 1994 ano
46.464
+1.883
4.22%
1 jan 1995 ano
48.082
+1.618
3.48%
1 jan 1996 ano
49.447
+1.364
2.84%
1 jan 1997 ano
50.593
+1.146
2.32%
1 jan 1998 ano
51.584
+0.991
1.96%
1 jan 1999 ano
52.455
+0.871
1.69%
1 jan 2000 ano
53.218
+0.763
1.45%
1 jan 2001 ano
53.881
+0.663
1.25%
1 jan 2002 ano
54.471
+0.59
1.09%
1 jan 2003 ano
54.997
+0.526
0.97%
1 jan 2004 ano
55.472
+0.475
0.86%
1 jan 2005 ano
55.902
+0.431
0.78%
1 jan 2006 ano
56.291
+0.389
0.7%
1 jan 2007 ano
56.647
+0.356
0.63%
1 jan 2008 ano
56.968
+0.321
0.57%
1 jan 2009 ano
57.271
+0.303
0.53%
1 jan 2010 ano
57.526
+0.255
0.45%
1 jan 2011 ano
57.749
+0.223
0.39%
1 jan 2012 ano
57.946
+0.197
0.34%
1 jan 2013 ano
58.1
+0.155
0.27%
1 jan 2014 ano
58.225
+0.124
0.21%
1 jan 2015 ano
58.329
+0.105
0.18%
1 jan 2016 ano
58.413
+0.084
0.14%
Classificação de países por estatísticas atuais por anos


Comentários: