29
/it/
it
AIzaSyAYiBZKx7MnpbEhh9jyipgxe19OcubqV5w
April 1, 2024
198449
Moldova
MDA
true
2
1
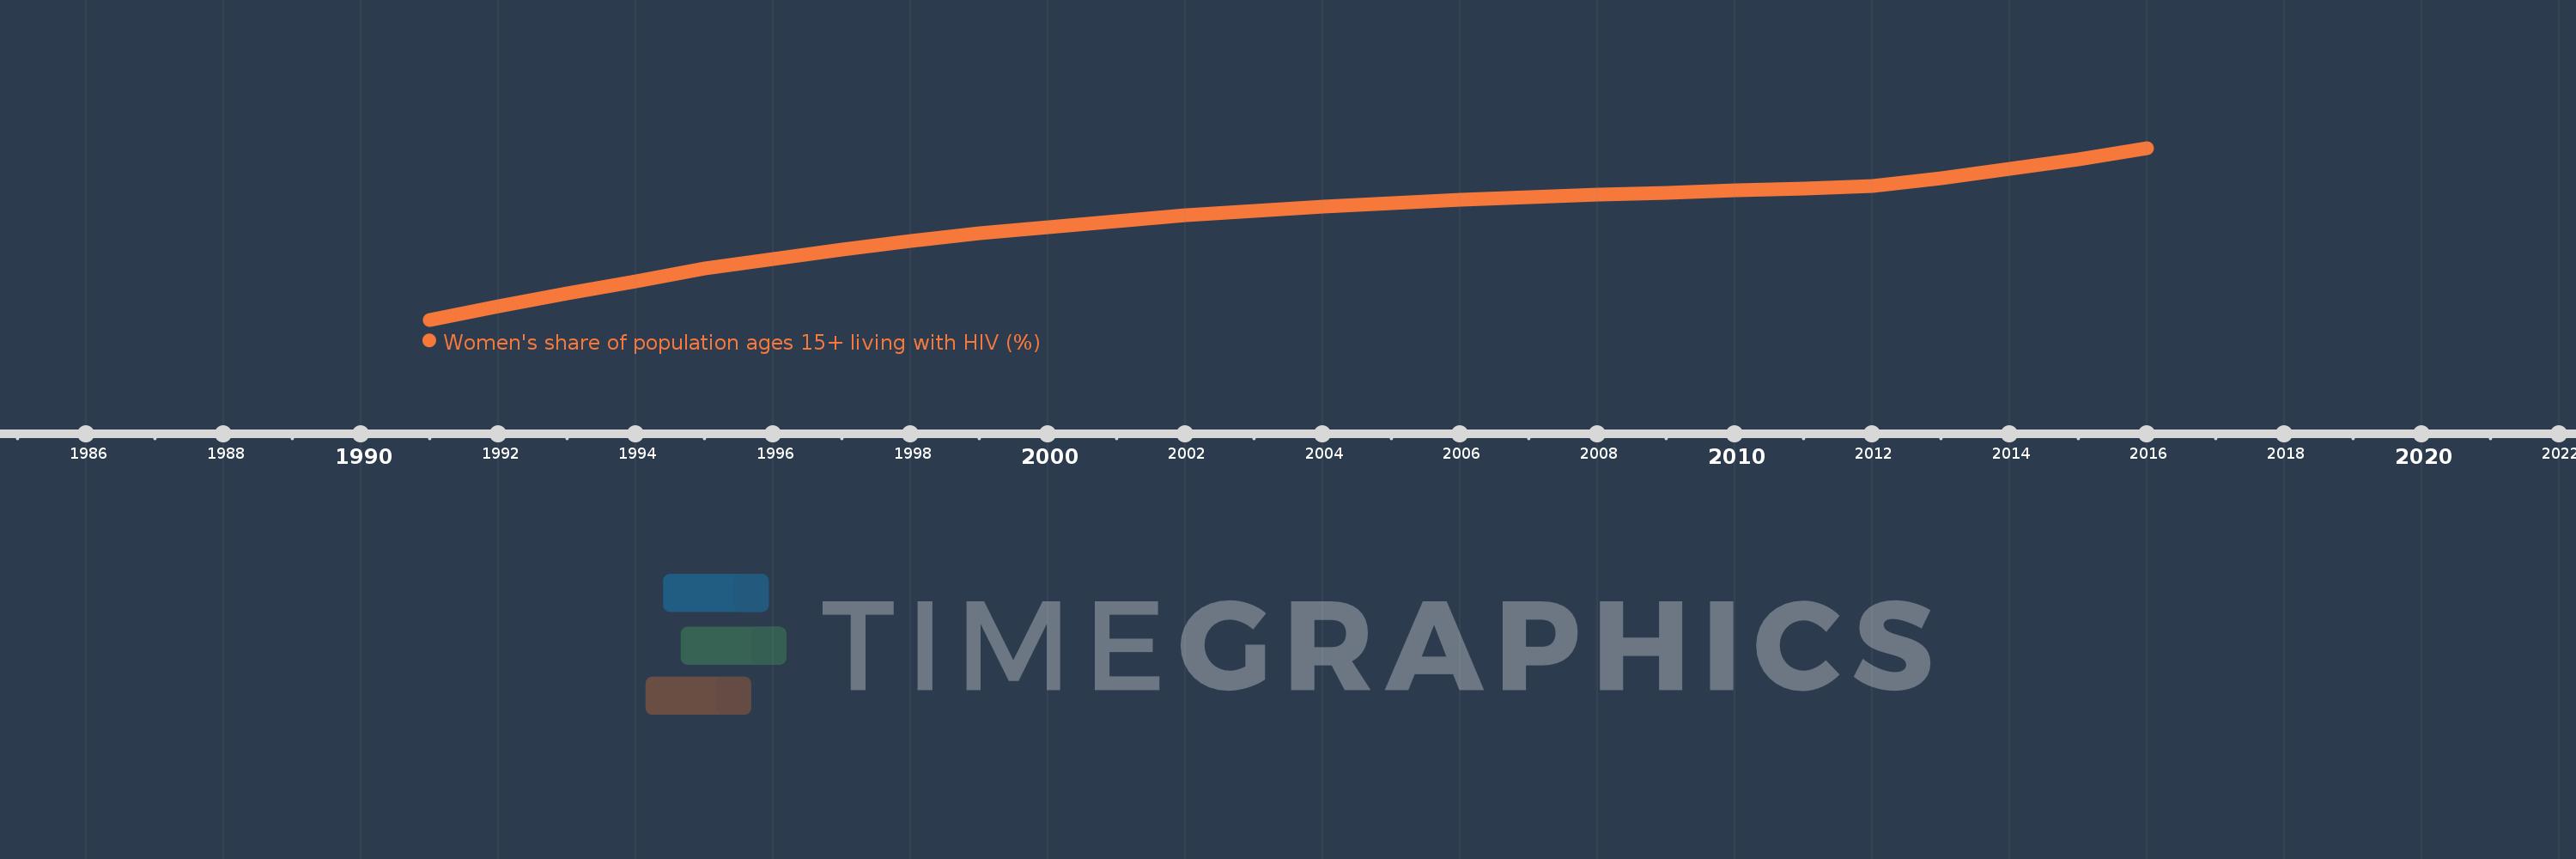
Women's share of population ages 15+ living with HIV (%)
2016,2015,2014,2013,2012,2011,2010,2009,2008,2007,2006,2005,2004,2003,2002,2001,2000,1999,1998,1997,1996,1995,1994,1993,1992,1991
Queste statistiche in altri paesi:
Linea del tempo:
Questa scala temporale mostra un grafico dal 1991 anno al 2016 anno. Moldova. I dati fino ad 1990 anno non disponibili. Il numero di osservazioni attuali secondo i date: 26.
La fonte (nome):
Indicatori dello sviluppo mondiale
La fonte (organizzazione):
UNAIDS estimates.
Categorie:
Health, Gender
sono stati aggiornati
23 apr 2017 anni
Indicatori delle variazioni dei valori per anni
Minima:
24.254
1 gen 1991 anni
Massimo:
32.041
1 gen 2016 anni
Alla data di osservazione
Valore
Variazione assoluta
La variazione rispetto al valore precedente
1 gen 1991 anni
24.254
+24.254
0.0%
1 gen 1992 anni
24.876
+0.622
2.56%
1 gen 1993 anni
25.455
+0.579
2.33%
1 gen 1994 anni
25.991
+0.536
2.11%
1 gen 1995 anni
26.574
+0.583
2.24%
1 gen 1996 anni
27.013
+0.439
1.65%
1 gen 1997 anni
27.447
+0.434
1.61%
1 gen 1998 anni
27.83
+0.382
1.39%
1 gen 1999 anni
28.158
+0.328
1.18%
1 gen 2000 anni
28.46
+0.303
1.07%
1 gen 2001 anni
28.734
+0.273
0.96%
1 gen 2002 anni
28.977
+0.243
0.85%
1 gen 2003 anni
29.189
+0.212
0.73%
1 gen 2004 anni
29.379
+0.19
0.65%
1 gen 2005 anni
29.545
+0.166
0.57%
1 gen 2006 anni
29.695
+0.15
0.51%
1 gen 2007 anni
29.818
+0.123
0.41%
1 gen 2008 anni
29.921
+0.103
0.35%
1 gen 2009 anni
30.02
+0.099
0.33%
1 gen 2010 anni
30.104
+0.083
0.28%
1 gen 2011 anni
30.2
+0.097
0.32%
1 gen 2012 anni
30.333
+0.132
0.44%
1 gen 2013 anni
30.667
+0.334
1.1%
1 gen 2014 anni
31.084
+0.417
1.36%
1 gen 2015 anni
31.516
+0.432
1.39%
1 gen 2016 anni
32.041
+0.524
1.66%
Classificazione dei paesi secondo i statistiche attuali per anni


Commenti: