29
/it/
it
AIzaSyAYiBZKx7MnpbEhh9jyipgxe19OcubqV5w
April 1, 2024
105604
Chile
CHL
true
2
1
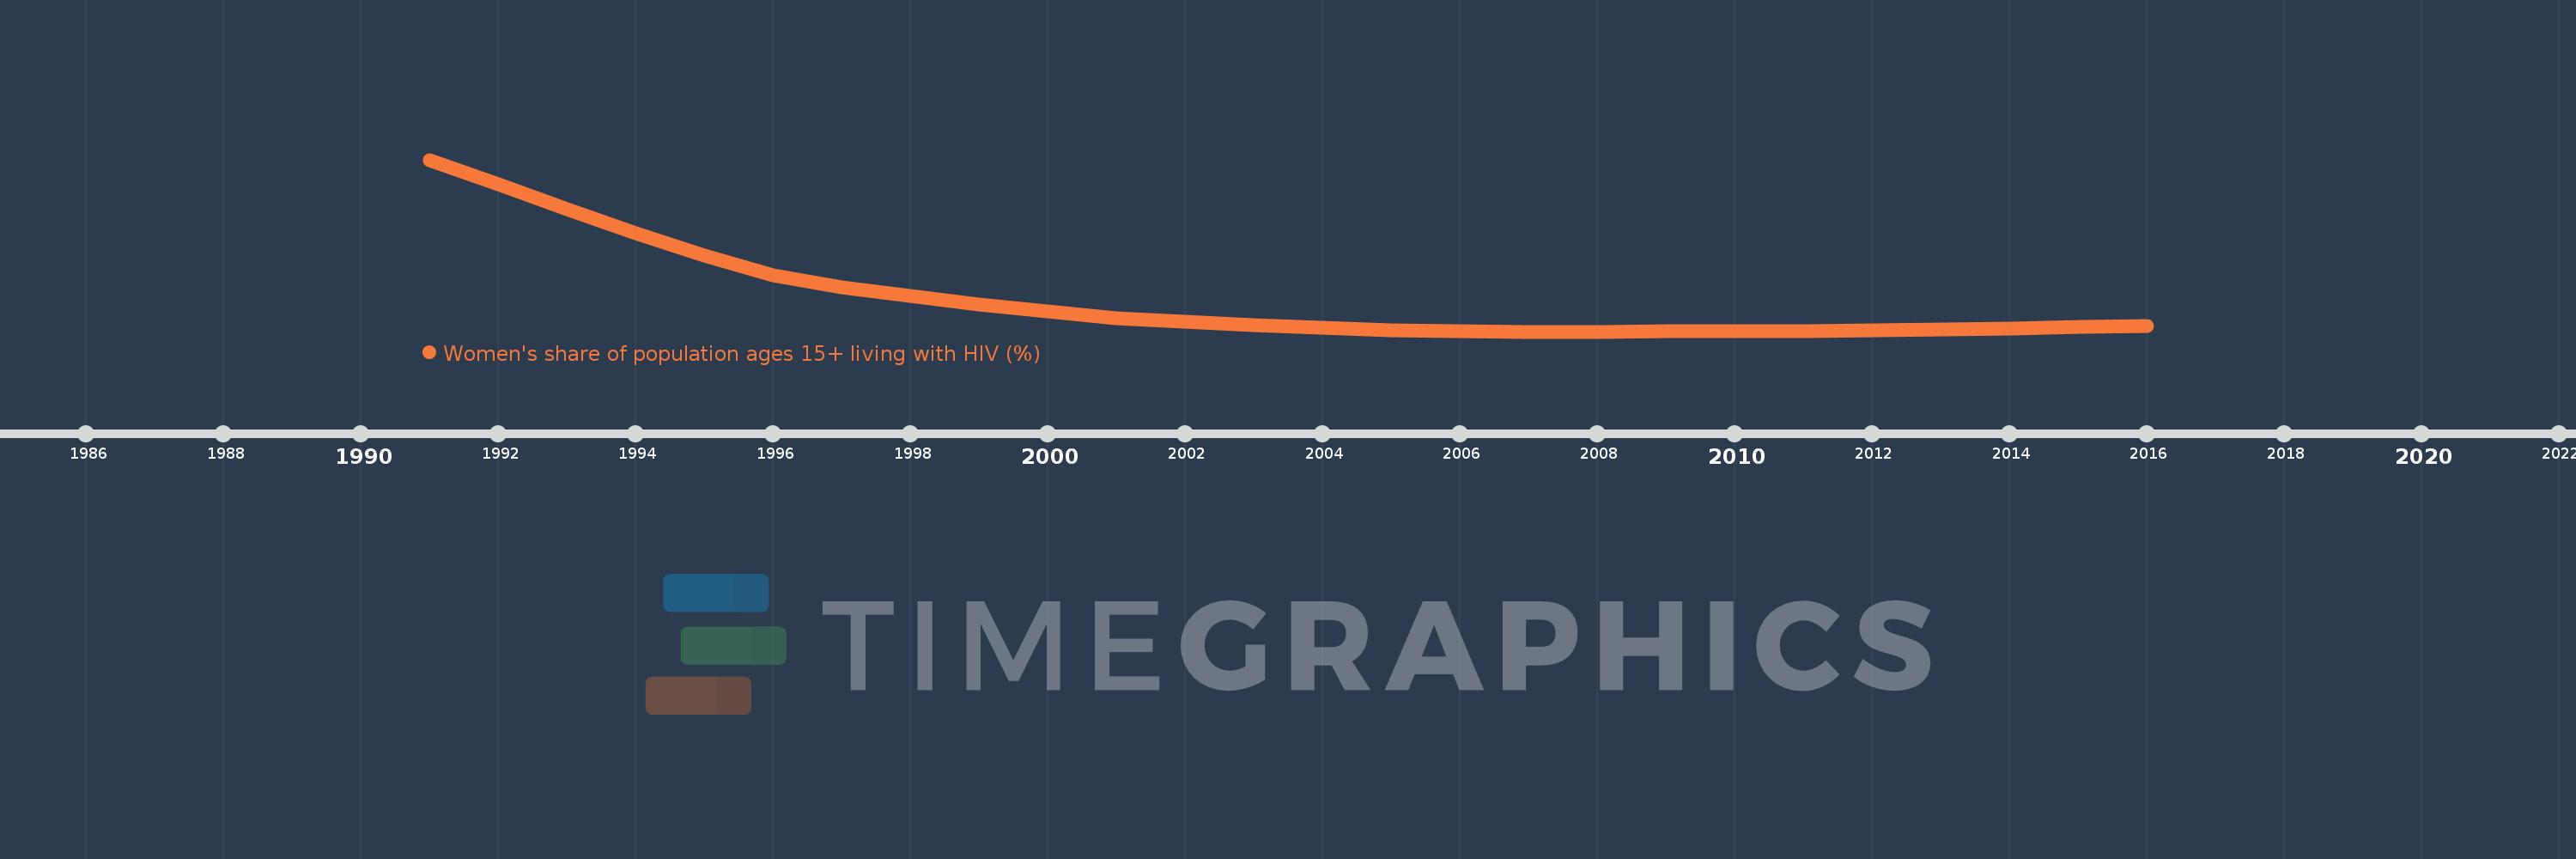
Women's share of population ages 15+ living with HIV (%)
2016,2015,2014,2013,2012,2011,2010,2009,2008,2007,2006,2005,2004,2003,2002,2001,2000,1999,1998,1997,1996,1995,1994,1993,1992,1991
Queste statistiche in altri paesi:
Linea del tempo:
Questa scala temporale mostra un grafico dal 1991 anno al 2016 anno. Chile. I dati fino ad 1990 anno non disponibili. Il numero di osservazioni attuali secondo i date: 26.
La fonte (nome):
Indicatori dello sviluppo mondiale
La fonte (organizzazione):
UNAIDS estimates.
Categorie:
Health, Gender
sono stati aggiornati
23 apr 2017 anni
Indicatori delle variazioni dei valori per anni
Minima:
3.741
1 gen 2007 anni
Massimo:
10.047
1 gen 1991 anni
Alla data di osservazione
Valore
Variazione assoluta
La variazione rispetto al valore precedente
1 gen 1991 anni
10.047
+10.047
0.0%
1 gen 1992 anni
9.133
-0.914
-9.09%
1 gen 1993 anni
8.223
-0.911
-9.97%
1 gen 1994 anni
7.341
-0.882
-10.72%
1 gen 1995 anni
6.517
-0.824
-11.23%
1 gen 1996 anni
5.8
-0.717
-11.0%
1 gen 1997 anni
5.373
-0.427
-7.37%
1 gen 1998 anni
5.034
-0.338
-6.29%
1 gen 1999 anni
4.738
-0.297
-5.9%
1 gen 2000 anni
4.467
-0.271
-5.72%
1 gen 2001 anni
4.245
-0.222
-4.97%
1 gen 2002 anni
4.09
-0.154
-3.64%
1 gen 2003 anni
3.972
-0.119
-2.9%
1 gen 2004 anni
3.868
-0.104
-2.61%
1 gen 2005 anni
3.797
-0.071
-1.83%
1 gen 2006 anni
3.759
-0.039
-1.02%
1 gen 2007 anni
3.741
-0.018
-0.48%
1 gen 2008 anni
3.741
+0.0
0.0%
1 gen 2009 anni
3.744
+0.004
0.1%
1 gen 2010 anni
3.751
+0.006
0.17%
1 gen 2011 anni
3.755
+0.004
0.11%
1 gen 2012 anni
3.773
+0.018
0.49%
1 gen 2013 anni
3.808
+0.035
0.93%
1 gen 2014 anni
3.853
+0.045
1.18%
1 gen 2015 anni
3.905
+0.051
1.33%
1 gen 2016 anni
3.96
+0.056
1.43%
Classificazione dei paesi secondo i statistiche attuali per anni


Commenti: