29
/it/
it
AIzaSyAYiBZKx7MnpbEhh9jyipgxe19OcubqV5w
April 1, 2024
155508
India
IND
true
2
1
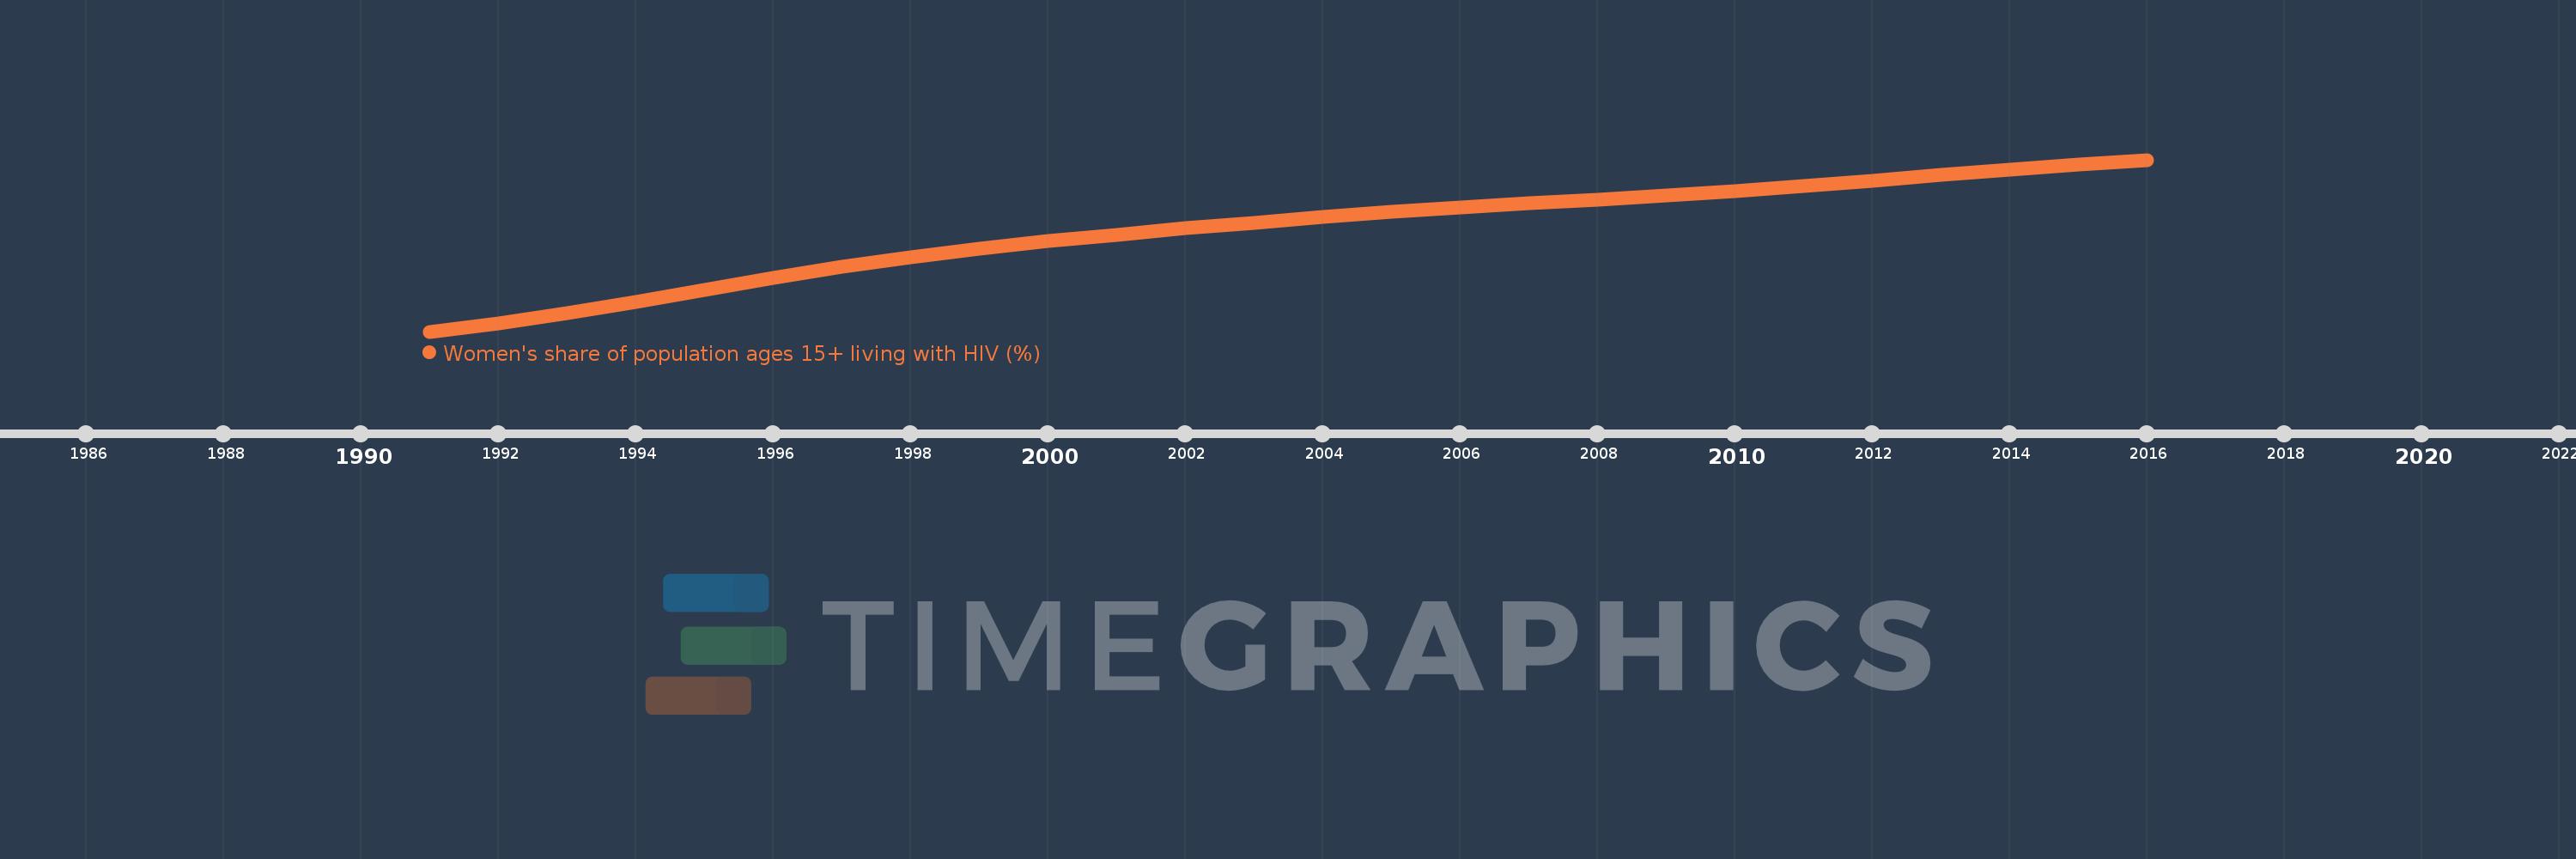
Women's share of population ages 15+ living with HIV (%)
2016,2015,2014,2013,2012,2011,2010,2009,2008,2007,2006,2005,2004,2003,2002,2001,2000,1999,1998,1997,1996,1995,1994,1993,1992,1991
Queste statistiche in altri paesi:
Linea del tempo:
Questa scala temporale mostra un grafico dal 1991 anno al 2016 anno. India. I dati fino ad 1990 anno non disponibili. Il numero di osservazioni attuali secondo i date: 26.
La fonte (nome):
Indicatori dello sviluppo mondiale
La fonte (organizzazione):
UNAIDS estimates.
Categorie:
Health, Gender
sono stati aggiornati
23 apr 2017 anni
Indicatori delle variazioni dei valori per anni
Minima:
27.487
1 gen 1991 anni
Massimo:
40.12
1 gen 2016 anni
Alla data di osservazione
Valore
Variazione assoluta
La variazione rispetto al valore precedente
1 gen 1991 anni
27.487
+27.487
0.0%
1 gen 1992 anni
28.113
+0.626
2.28%
1 gen 1993 anni
28.827
+0.714
2.54%
1 gen 1994 anni
29.643
+0.816
2.83%
1 gen 1995 anni
30.553
+0.911
3.07%
1 gen 1996 anni
31.464
+0.91
2.98%
1 gen 1997 anni
32.253
+0.79
2.51%
1 gen 1998 anni
32.921
+0.668
2.07%
1 gen 1999 anni
33.563
+0.642
1.95%
1 gen 2000 anni
34.123
+0.56
1.67%
1 gen 2001 anni
34.618
+0.495
1.45%
1 gen 2002 anni
35.071
+0.452
1.31%
1 gen 2003 anni
35.499
+0.429
1.22%
1 gen 2004 anni
35.904
+0.405
1.14%
1 gen 2005 anni
36.276
+0.371
1.03%
1 gen 2006 anni
36.616
+0.34
0.94%
1 gen 2007 anni
36.922
+0.306
0.84%
1 gen 2008 anni
37.206
+0.284
0.77%
1 gen 2009 anni
37.502
+0.297
0.8%
1 gen 2010 anni
37.824
+0.322
0.86%
1 gen 2011 anni
38.187
+0.363
0.96%
1 gen 2012 anni
38.594
+0.408
1.07%
1 gen 2013 anni
39.012
+0.418
1.08%
1 gen 2014 anni
39.413
+0.401
1.03%
1 gen 2015 anni
39.788
+0.375
0.95%
1 gen 2016 anni
40.12
+0.332
0.83%
Classificazione dei paesi secondo i statistiche attuali per anni


Commenti: