29
/it/
it
AIzaSyAYiBZKx7MnpbEhh9jyipgxe19OcubqV5w
April 1, 2024
98415
Cambodia
KHM
true
2
1
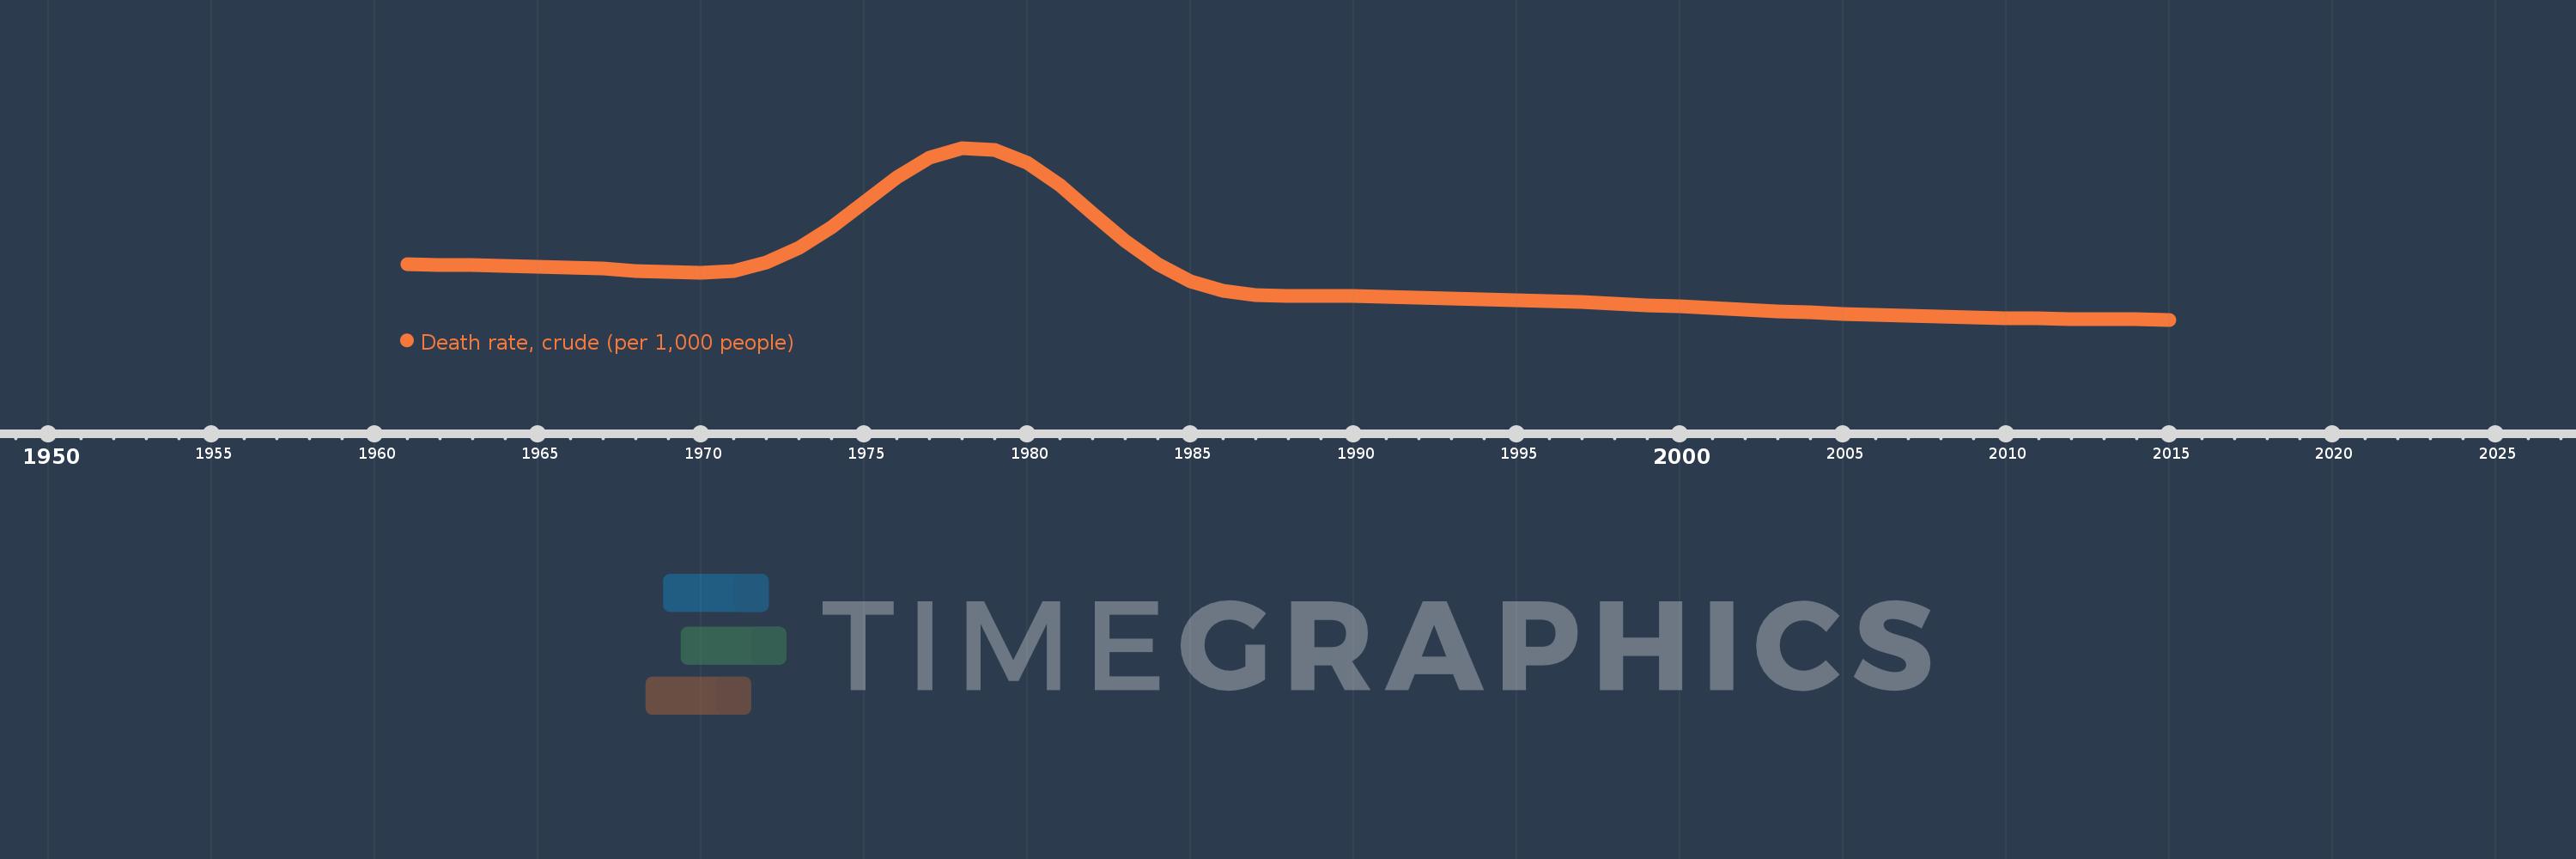
Death rate, crude (per 1,000 people)
2015,2014,2013,2012,2011,2010,2009,2008,2007,2006,2005,2004,2003,2002,2001,2000,1999,1998,1997,1996,1995,1994,1993,1992,1991,1990,1989,1988,1987,1986,1985,1984,1983,1982,1981,1980,1979,1978,1977,1976,1975,1974,1973,1972,1971,1970,1969,1968,1967,1966,1965,1964,1963,1962,1961
Queste statistiche in altri paesi:
AfghanistanAlbaniaAlgeriaAmerican SamoaAndorraAngolaAntigua and BarbudaArab WorldArgentinaArmeniaArubaAustraliaAustriaAzerbaijanBahamas, TheBahrainBangladeshBarbadosBelarusBelgiumBelizeBeninBermudaBhutanBoliviaBosnia and HerzegovinaBotswanaBrazilBrunei DarussalamBulgariaBurkina FasoBurundiCabo VerdeCambodiaCameroonCanadaCaribbean small statesCayman IslandsCentral African RepublicCentral Europe and the BalticsChadChannel IslandsChileChinaColombiaComorosCongo, Dem. Rep.Congo, Rep.Costa RicaCote d'IvoireCroatiaCubaCuracaoCyprusCzech RepublicDenmarkDjiboutiDominicaDominican RepublicEarly-demographic dividendEast Asia & PacificEast Asia & Pacific (excluding high income)East Asia & Pacific (IDA & IBRD countries)EcuadorEgypt, Arab Rep.El SalvadorEquatorial GuineaEritreaEstoniaEthiopiaEuro areaEurope & Central AsiaEurope & Central Asia (excluding high income)Europe & Central Asia (IDA & IBRD countries)European UnionFaroe IslandsFijiFinlandFragile and conflict affected situationsFranceFrench PolynesiaGabonGambia, TheGeorgiaGermanyGhanaGreeceGreenlandGrenadaGuamGuatemalaGuineaGuinea-BissauGuyanaHaitiHeavily indebted poor countries (HIPC)High incomeHondurasHong Kong SAR, ChinaHungaryIBRD onlyIcelandIDA & IBRD totalIDA blendIDA onlyIDA totalIndiaIndonesiaIran, Islamic Rep.IraqIrelandIsle of ManIsraelItalyJamaicaJapanJordanKazakhstanKenyaKiribatiKorea, Dem. People’s Rep.Korea, Rep.KosovoKuwaitKyrgyz RepublicLao PDRLate-demographic dividendLatin America & Caribbean Latin America & Caribbean (excluding high income)Latin America & the Caribbean (IDA & IBRD countries)LatviaLeast developed countries: UN classificationLebanonLesothoLiberiaLibyaLiechtensteinLithuaniaLow & middle incomeLow incomeLower middle incomeLuxembourgMacao SAR, ChinaMacedonia, FYRMadagascarMalawiMalaysiaMaldivesMaliMaltaMarshall IslandsMauritaniaMauritiusMexicoMicronesia, Fed. Sts.Middle East & North AfricaMiddle East & North Africa (excluding high income)Middle East & North Africa (IDA & IBRD countries)Middle incomeMoldovaMonacoMongoliaMontenegroMoroccoMozambiqueMyanmarNamibiaNepalNetherlandsNew CaledoniaNew ZealandNicaraguaNigerNigeriaNorth AmericaNorwayOECD membersOmanOther small statesPacific island small statesPakistanPalauPanamaPapua New GuineaParaguayPeruPhilippinesPolandPortugalPost-demographic dividendPre-demographic dividendPuerto RicoQatarRomaniaRussian FederationRwandaSamoaSan MarinoSao Tome and PrincipeSaudi ArabiaSenegalSerbiaSeychellesSierra LeoneSingaporeSint Maarten (Dutch part)Slovak RepublicSloveniaSmall statesSolomon IslandsSomaliaSouth AfricaSouth AsiaSouth Asia (IDA & IBRD)South SudanSpainSri LankaSt. Kitts and NevisSt. LuciaSt. Martin (French part)St. Vincent and the GrenadinesSub-Saharan Africa Sub-Saharan Africa (excluding high income)Sub-Saharan Africa (IDA & IBRD countries)SudanSurinameSwazilandSwedenSwitzerlandSyrian Arab RepublicTajikistanTanzaniaThailandTimor-LesteTogoTongaTrinidad and TobagoTunisiaTurkeyTurkmenistanUgandaUkraineUnited Arab EmiratesUnited KingdomUnited StatesUpper middle incomeUruguayUzbekistanVanuatuVenezuela, RBVietnamVirgin Islands (U.S.)West Bank and GazaWorldYemen, Rep.ZambiaZimbabwe Linea del tempo:
Questa scala temporale mostra un grafico dal 1961 anno al 2015 anno. Cambodia. I dati fino ad 1960 anno non disponibili. Il numero di osservazioni attuali secondo i date: 55.
La fonte (nome):
Indicatori dello sviluppo mondiale
La fonte (organizzazione):
(1) United Nations Population Division. World Population Prospects, (2) Census reports and other statistical publications from national statistical offices, (3) Eurostat: Demographic Statistics, (4) United Nations Statistical Division. Population and Vital Statistics Reprot (various years), (5) U.S. Census Bureau: International Database, and (6) Secretariat of the Pacific Community: Statistics and Demography Programme.
Categorie:
Health
sono stati aggiornati
23 apr 2017 anni
Indicatori delle variazioni dei valori per anni
Minima:
6.127
1 gen 2015 anni
Massimo:
54.439
1 gen 1978 anni
Alla data di osservazione
Valore
Variazione assoluta
La variazione rispetto al valore precedente
1 gen 1961 anni
21.772
+21.772
0.0%
1 gen 1962 anni
21.611
-0.161
-0.74%
1 gen 1963 anni
21.434
-0.177
-0.82%
1 gen 1964 anni
21.248
-0.186
-0.87%
1 gen 1965 anni
21.075
-0.173
-0.81%
1 gen 1966 anni
20.843
-0.232
-1.1%
1 gen 1967 anni
20.452
-0.391
-1.88%
1 gen 1968 anni
19.943
-0.509
-2.49%
1 gen 1969 anni
19.463
-0.48
-2.41%
1 gen 1970 anni
19.225
-0.238
-1.22%
1 gen 1971 anni
19.868
+0.643
3.34%
1 gen 1972 anni
22.152
+2.284
11.5%
1 gen 1973 anni
26.311
+4.159
18.77%
1 gen 1974 anni
32.161
+5.85
22.23%
1 gen 1975 anni
39.182
+7.021
21.83%
1 gen 1976 anni
46.177
+6.995
17.85%
1 gen 1977 anni
51.638
+5.461
11.83%
1 gen 1978 anni
54.439
+2.801
5.42%
1 gen 1979 anni
53.975
-0.464
-0.85%
1 gen 1980 anni
50.257
-3.718
-6.89%
1 gen 1981 anni
43.915
-6.342
-12.62%
1 gen 1982 anni
36.097
-7.818
-17.8%
1 gen 1983 anni
28.32
-7.777
-21.54%
1 gen 1984 anni
21.783
-6.537
-23.08%
1 gen 1985 anni
17.005
-4.778
-21.93%
1 gen 1986 anni
14.164
-2.841
-16.71%
1 gen 1987 anni
13.008
-1.156
-8.16%
1 gen 1988 anni
12.757
-0.251
-1.93%
1 gen 1989 anni
12.753
-0.004
-0.03%
1 gen 1990 anni
12.775
+0.022
0.17%
1 gen 1991 anni
12.679
-0.096
-0.75%
1 gen 1992 anni
12.431
-0.248
-1.96%
1 gen 1993 anni
12.141
-0.29
-2.33%
1 gen 1994 anni
11.882
-0.259
-2.13%
1 gen 1995 anni
11.626
-0.256
-2.15%
1 gen 1996 anni
11.348
-0.278
-2.39%
1 gen 1997 anni
11.028
-0.32
-2.82%
1 gen 1998 anni
10.67
-0.358
-3.25%
1 gen 1999 anni
10.281
-0.389
-3.65%
1 gen 2000 anni
9.864
-0.417
-4.06%
1 gen 2001 anni
9.426
-0.438
-4.44%
1 gen 2002 anni
8.983
-0.443
-4.7%
1 gen 2003 anni
8.553
-0.43
-4.79%
1 gen 2004 anni
8.153
-0.4
-4.68%
1 gen 2005 anni
7.792
-0.361
-4.43%
1 gen 2006 anni
7.479
-0.313
-4.02%
1 gen 2007 anni
7.216
-0.263
-3.52%
1 gen 2008 anni
6.996
-0.22
-3.05%
1 gen 2009 anni
6.81
-0.186
-2.66%
1 gen 2010 anni
6.655
-0.155
-2.28%
1 gen 2011 anni
6.525
-0.13
-1.95%
1 gen 2012 anni
6.412
-0.113
-1.73%
1 gen 2013 anni
6.312
-0.1
-1.56%
1 gen 2014 anni
6.218
-0.094
-1.49%
1 gen 2015 anni
6.127
-0.091
-1.46%
Classificazione dei paesi secondo i statistiche attuali per anni


Commenti: