29
/it/
it
AIzaSyAYiBZKx7MnpbEhh9jyipgxe19OcubqV5w
April 1, 2024
28984
East Asia & Pacific (IDA & IBRD countries)
TEA
false
2
1
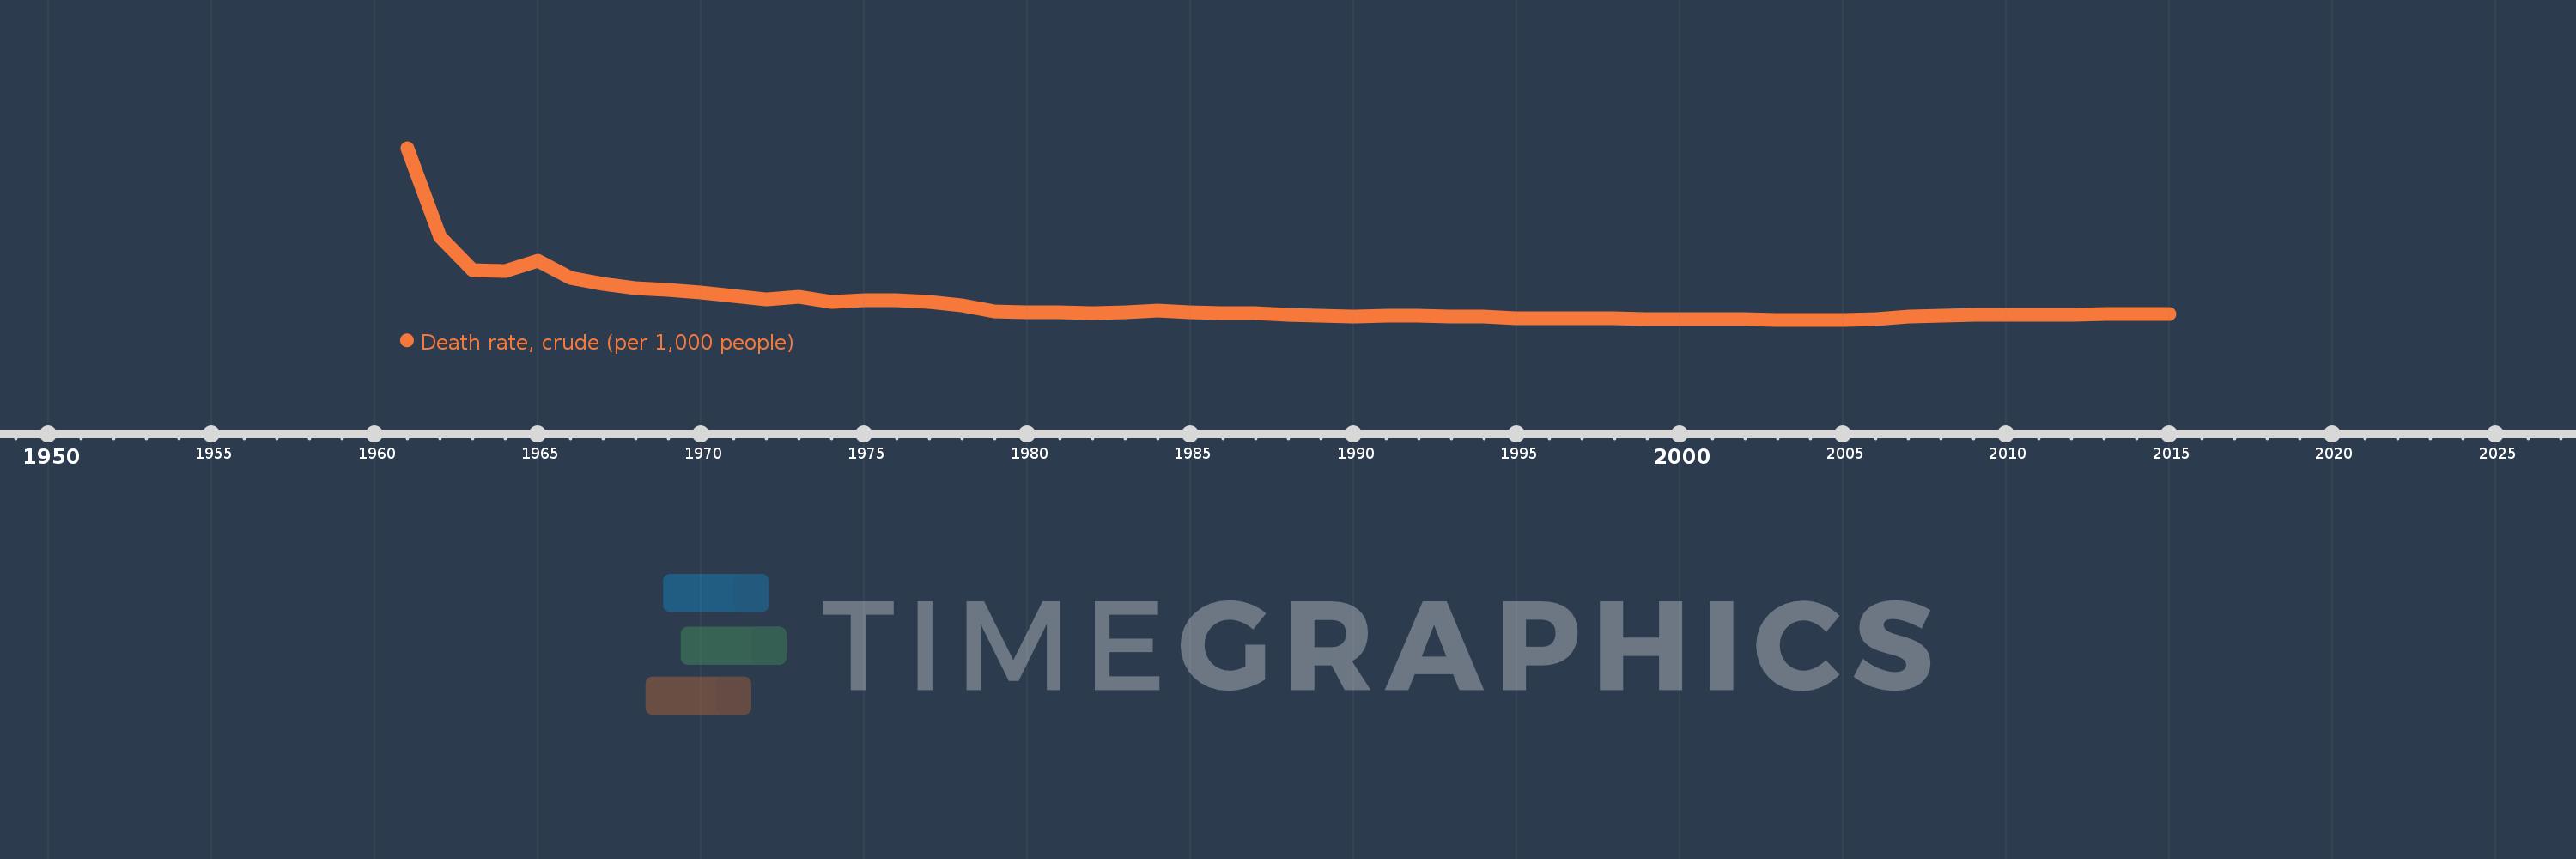
Death rate, crude (per 1,000 people)
2015,2014,2013,2012,2011,2010,2009,2008,2007,2006,2005,2004,2003,2002,2001,2000,1999,1998,1997,1996,1995,1994,1993,1992,1991,1990,1989,1988,1987,1986,1985,1984,1983,1982,1981,1980,1979,1978,1977,1976,1975,1974,1973,1972,1971,1970,1969,1968,1967,1966,1965,1964,1963,1962,1961
Queste statistiche in altri paesi:
AfghanistanAlbaniaAlgeriaAmerican SamoaAndorraAngolaAntigua and BarbudaArab WorldArgentinaArmeniaArubaAustraliaAustriaAzerbaijanBahamas, TheBahrainBangladeshBarbadosBelarusBelgiumBelizeBeninBermudaBhutanBoliviaBosnia and HerzegovinaBotswanaBrazilBrunei DarussalamBulgariaBurkina FasoBurundiCabo VerdeCambodiaCameroonCanadaCaribbean small statesCayman IslandsCentral African RepublicCentral Europe and the BalticsChadChannel IslandsChileChinaColombiaComorosCongo, Dem. Rep.Congo, Rep.Costa RicaCote d'IvoireCroatiaCubaCuracaoCyprusCzech RepublicDenmarkDjiboutiDominicaDominican RepublicEarly-demographic dividendEast Asia & PacificEast Asia & Pacific (excluding high income)East Asia & Pacific (IDA & IBRD countries)EcuadorEgypt, Arab Rep.El SalvadorEquatorial GuineaEritreaEstoniaEthiopiaEuro areaEurope & Central AsiaEurope & Central Asia (excluding high income)Europe & Central Asia (IDA & IBRD countries)European UnionFaroe IslandsFijiFinlandFragile and conflict affected situationsFranceFrench PolynesiaGabonGambia, TheGeorgiaGermanyGhanaGreeceGreenlandGrenadaGuamGuatemalaGuineaGuinea-BissauGuyanaHaitiHeavily indebted poor countries (HIPC)High incomeHondurasHong Kong SAR, ChinaHungaryIBRD onlyIcelandIDA & IBRD totalIDA blendIDA onlyIDA totalIndiaIndonesiaIran, Islamic Rep.IraqIrelandIsle of ManIsraelItalyJamaicaJapanJordanKazakhstanKenyaKiribatiKorea, Dem. People’s Rep.Korea, Rep.KosovoKuwaitKyrgyz RepublicLao PDRLate-demographic dividendLatin America & Caribbean Latin America & Caribbean (excluding high income)Latin America & the Caribbean (IDA & IBRD countries)LatviaLeast developed countries: UN classificationLebanonLesothoLiberiaLibyaLiechtensteinLithuaniaLow & middle incomeLow incomeLower middle incomeLuxembourgMacao SAR, ChinaMacedonia, FYRMadagascarMalawiMalaysiaMaldivesMaliMaltaMarshall IslandsMauritaniaMauritiusMexicoMicronesia, Fed. Sts.Middle East & North AfricaMiddle East & North Africa (excluding high income)Middle East & North Africa (IDA & IBRD countries)Middle incomeMoldovaMonacoMongoliaMontenegroMoroccoMozambiqueMyanmarNamibiaNepalNetherlandsNew CaledoniaNew ZealandNicaraguaNigerNigeriaNorth AmericaNorwayOECD membersOmanOther small statesPacific island small statesPakistanPalauPanamaPapua New GuineaParaguayPeruPhilippinesPolandPortugalPost-demographic dividendPre-demographic dividendPuerto RicoQatarRomaniaRussian FederationRwandaSamoaSan MarinoSao Tome and PrincipeSaudi ArabiaSenegalSerbiaSeychellesSierra LeoneSingaporeSint Maarten (Dutch part)Slovak RepublicSloveniaSmall statesSolomon IslandsSomaliaSouth AfricaSouth AsiaSouth Asia (IDA & IBRD)South SudanSpainSri LankaSt. Kitts and NevisSt. LuciaSt. Martin (French part)St. Vincent and the GrenadinesSub-Saharan Africa Sub-Saharan Africa (excluding high income)Sub-Saharan Africa (IDA & IBRD countries)SudanSurinameSwazilandSwedenSwitzerlandSyrian Arab RepublicTajikistanTanzaniaThailandTimor-LesteTogoTongaTrinidad and TobagoTunisiaTurkeyTurkmenistanUgandaUkraineUnited Arab EmiratesUnited KingdomUnited StatesUpper middle incomeUruguayUzbekistanVanuatuVenezuela, RBVietnamVirgin Islands (U.S.)West Bank and GazaWorldYemen, Rep.ZambiaZimbabwe Linea del tempo:
Questa scala temporale mostra un grafico dal 1961 anno al 2015 anno. East Asia & Pacific (IDA & IBRD countries). I dati fino ad 1960 anno non disponibili. Il numero di osservazioni attuali secondo i date: 55.
La fonte (nome):
Indicatori dello sviluppo mondiale
La fonte (organizzazione):
(1) United Nations Population Division. World Population Prospects, (2) Census reports and other statistical publications from national statistical offices, (3) Eurostat: Demographic Statistics, (4) United Nations Statistical Division. Population and Vital Statistics Reprot (various years), (5) U.S. Census Bureau: International Database, and (6) Secretariat of the Pacific Community: Statistics and Demography Programme.
Categorie:
Health
sono stati aggiornati
23 apr 2017 anni
Indicatori delle variazioni dei valori per anni
Minima:
6.547
1 gen 2004 anni
Massimo:
23.087
1 gen 1961 anni
Alla data di osservazione
Valore
Variazione assoluta
La variazione rispetto al valore precedente
1 gen 1961 anni
23.087
+23.087
0.0%
1 gen 1962 anni
14.554
-8.533
-36.96%
1 gen 1963 anni
11.309
-3.245
-22.3%
1 gen 1964 anni
11.214
-0.095
-0.84%
1 gen 1965 anni
12.191
+0.977
8.71%
1 gen 1966 anni
10.603
-1.588
-13.03%
1 gen 1967 anni
10.007
-0.596
-5.63%
1 gen 1968 anni
9.621
-0.385
-3.85%
1 gen 1969 anni
9.379
-0.242
-2.51%
1 gen 1970 anni
9.176
-0.203
-2.17%
1 gen 1971 anni
8.797
-0.379
-4.13%
1 gen 1972 anni
8.54
-0.257
-2.92%
1 gen 1973 anni
8.716
+0.176
2.06%
1 gen 1974 anni
8.258
-0.458
-5.25%
1 gen 1975 anni
8.446
+0.187
2.27%
1 gen 1976 anni
8.388
-0.058
-0.68%
1 gen 1977 anni
8.278
-0.11
-1.31%
1 gen 1978 anni
7.923
-0.355
-4.29%
1 gen 1979 anni
7.38
-0.544
-6.86%
1 gen 1980 anni
7.257
-0.123
-1.67%
1 gen 1981 anni
7.258
+0.002
0.02%
1 gen 1982 anni
7.182
-0.076
-1.05%
1 gen 1983 anni
7.271
+0.088
1.23%
1 gen 1984 anni
7.409
+0.138
1.9%
1 gen 1985 anni
7.28
-0.129
-1.75%
1 gen 1986 anni
7.189
-0.091
-1.25%
1 gen 1987 anni
7.194
+0.005
0.07%
1 gen 1988 anni
7.048
-0.146
-2.03%
1 gen 1989 anni
6.951
-0.097
-1.37%
1 gen 1990 anni
6.845
-0.106
-1.52%
1 gen 1991 anni
6.909
+0.063
0.93%
1 gen 1992 anni
6.903
-0.005
-0.08%
1 gen 1993 anni
6.836
-0.067
-0.97%
1 gen 1994 anni
6.814
-0.022
-0.32%
1 gen 1995 anni
6.687
-0.127
-1.87%
1 gen 1996 anni
6.726
+0.039
0.58%
1 gen 1997 anni
6.702
-0.023
-0.34%
1 gen 1998 anni
6.654
-0.048
-0.72%
1 gen 1999 anni
6.638
-0.016
-0.25%
1 gen 2000 anni
6.603
-0.035
-0.52%
1 gen 2001 anni
6.592
-0.011
-0.17%
1 gen 2002 anni
6.575
-0.017
-0.26%
1 gen 2003 anni
6.558
-0.017
-0.26%
1 gen 2004 anni
6.547
-0.011
-0.16%
1 gen 2005 anni
6.556
+0.009
0.14%
1 gen 2006 anni
6.614
+0.058
0.88%
1 gen 2007 anni
6.818
+0.204
3.09%
1 gen 2008 anni
6.898
+0.08
1.17%
1 gen 2009 anni
6.987
+0.089
1.29%
1 gen 2010 anni
7.003
+0.015
0.22%
1 gen 2011 anni
7.027
+0.025
0.35%
1 gen 2012 anni
7.054
+0.026
0.37%
1 gen 2013 anni
7.067
+0.014
0.19%
1 gen 2014 anni
7.081
+0.014
0.2%
1 gen 2015 anni
7.116
+0.035
0.49%
Classificazione dei paesi secondo i statistiche attuali per anni


Commenti: