29
/it/
it
AIzaSyAYiBZKx7MnpbEhh9jyipgxe19OcubqV5w
April 1, 2024
234495
Saudi Arabia
SAU
true
2
1
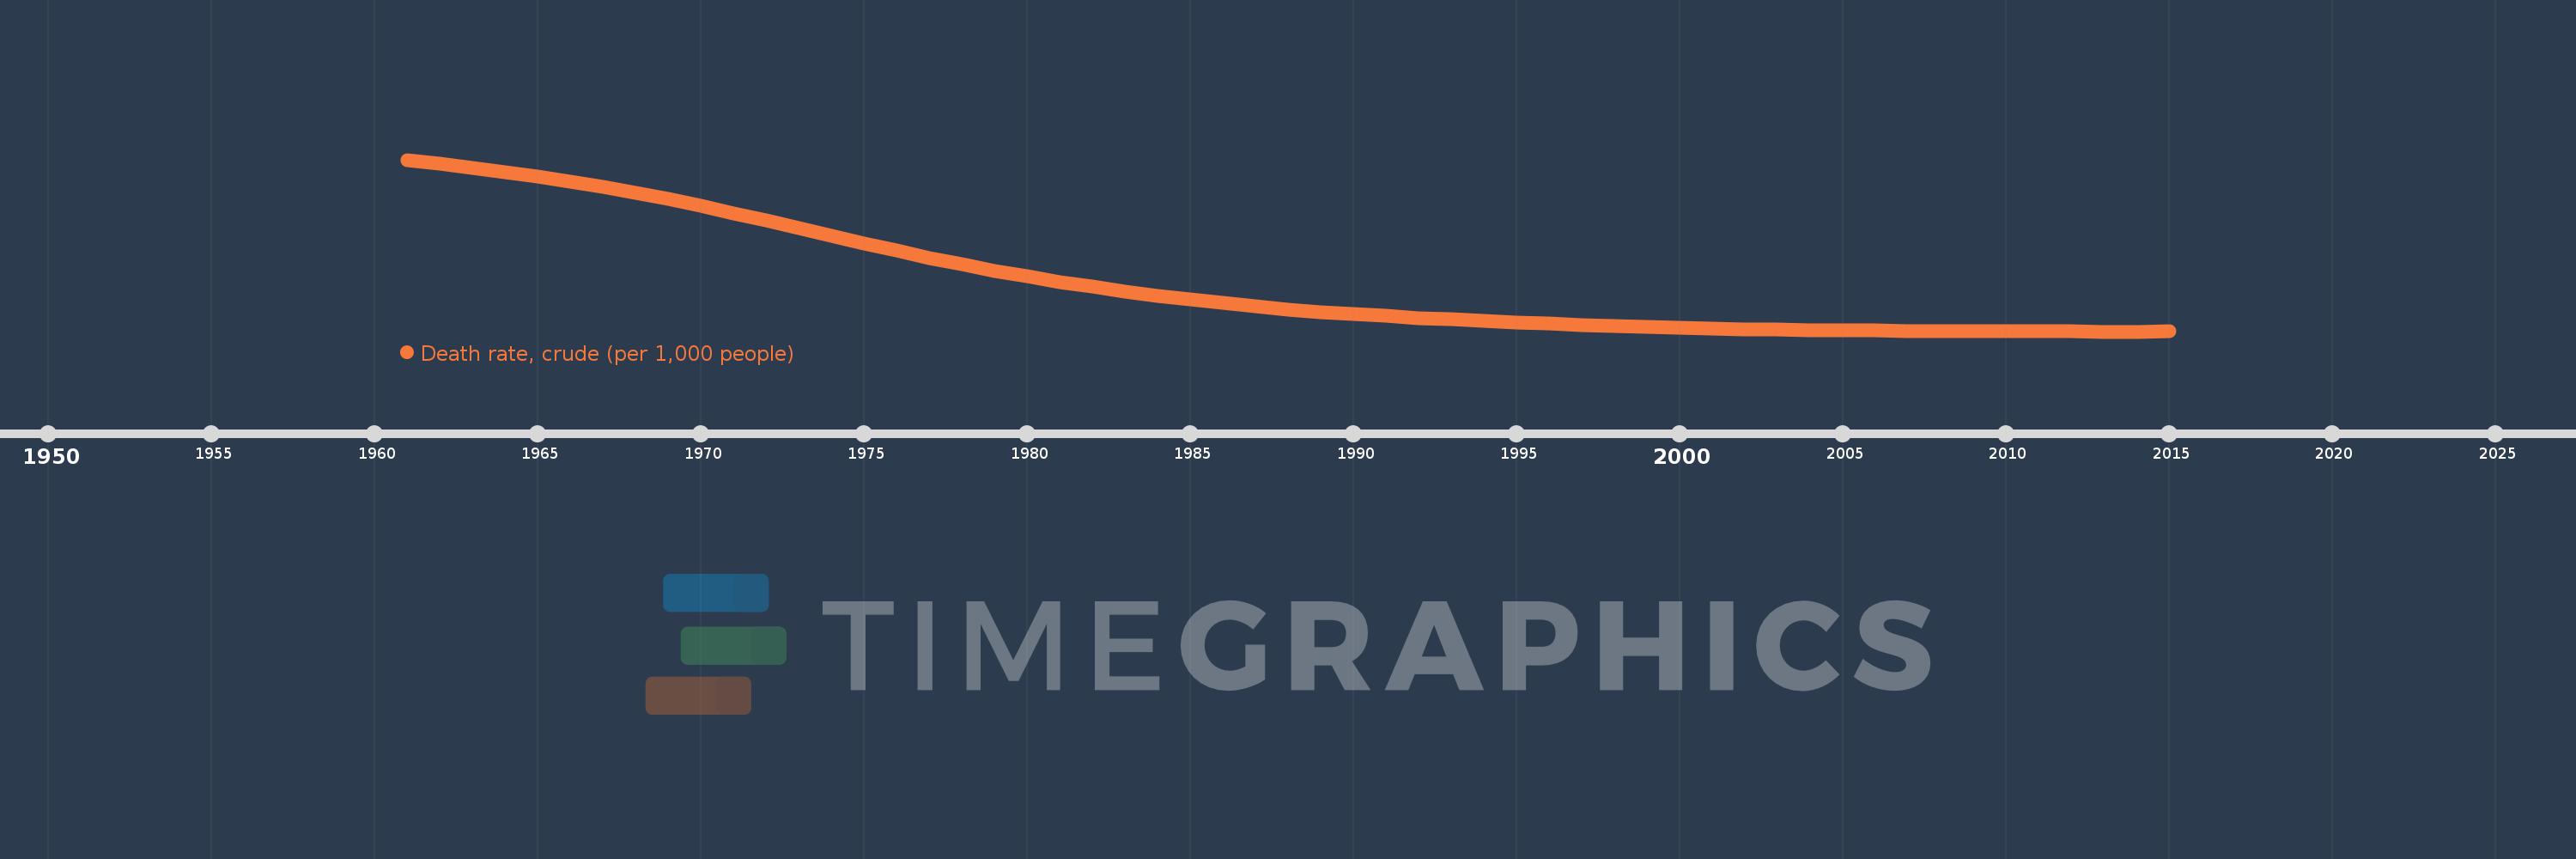
Death rate, crude (per 1,000 people)
2015,2014,2013,2012,2011,2010,2009,2008,2007,2006,2005,2004,2003,2002,2001,2000,1999,1998,1997,1996,1995,1994,1993,1992,1991,1990,1989,1988,1987,1986,1985,1984,1983,1982,1981,1980,1979,1978,1977,1976,1975,1974,1973,1972,1971,1970,1969,1968,1967,1966,1965,1964,1963,1962,1961
Queste statistiche in altri paesi:
AfghanistanAlbaniaAlgeriaAmerican SamoaAndorraAngolaAntigua and BarbudaArab WorldArgentinaArmeniaArubaAustraliaAustriaAzerbaijanBahamas, TheBahrainBangladeshBarbadosBelarusBelgiumBelizeBeninBermudaBhutanBoliviaBosnia and HerzegovinaBotswanaBrazilBrunei DarussalamBulgariaBurkina FasoBurundiCabo VerdeCambodiaCameroonCanadaCaribbean small statesCayman IslandsCentral African RepublicCentral Europe and the BalticsChadChannel IslandsChileChinaColombiaComorosCongo, Dem. Rep.Congo, Rep.Costa RicaCote d'IvoireCroatiaCubaCuracaoCyprusCzech RepublicDenmarkDjiboutiDominicaDominican RepublicEarly-demographic dividendEast Asia & PacificEast Asia & Pacific (excluding high income)East Asia & Pacific (IDA & IBRD countries)EcuadorEgypt, Arab Rep.El SalvadorEquatorial GuineaEritreaEstoniaEthiopiaEuro areaEurope & Central AsiaEurope & Central Asia (excluding high income)Europe & Central Asia (IDA & IBRD countries)European UnionFaroe IslandsFijiFinlandFragile and conflict affected situationsFranceFrench PolynesiaGabonGambia, TheGeorgiaGermanyGhanaGreeceGreenlandGrenadaGuamGuatemalaGuineaGuinea-BissauGuyanaHaitiHeavily indebted poor countries (HIPC)High incomeHondurasHong Kong SAR, ChinaHungaryIBRD onlyIcelandIDA & IBRD totalIDA blendIDA onlyIDA totalIndiaIndonesiaIran, Islamic Rep.IraqIrelandIsle of ManIsraelItalyJamaicaJapanJordanKazakhstanKenyaKiribatiKorea, Dem. People’s Rep.Korea, Rep.KosovoKuwaitKyrgyz RepublicLao PDRLate-demographic dividendLatin America & Caribbean Latin America & Caribbean (excluding high income)Latin America & the Caribbean (IDA & IBRD countries)LatviaLeast developed countries: UN classificationLebanonLesothoLiberiaLibyaLiechtensteinLithuaniaLow & middle incomeLow incomeLower middle incomeLuxembourgMacao SAR, ChinaMacedonia, FYRMadagascarMalawiMalaysiaMaldivesMaliMaltaMarshall IslandsMauritaniaMauritiusMexicoMicronesia, Fed. Sts.Middle East & North AfricaMiddle East & North Africa (excluding high income)Middle East & North Africa (IDA & IBRD countries)Middle incomeMoldovaMonacoMongoliaMontenegroMoroccoMozambiqueMyanmarNamibiaNepalNetherlandsNew CaledoniaNew ZealandNicaraguaNigerNigeriaNorth AmericaNorwayOECD membersOmanOther small statesPacific island small statesPakistanPalauPanamaPapua New GuineaParaguayPeruPhilippinesPolandPortugalPost-demographic dividendPre-demographic dividendPuerto RicoQatarRomaniaRussian FederationRwandaSamoaSan MarinoSao Tome and PrincipeSaudi ArabiaSenegalSerbiaSeychellesSierra LeoneSingaporeSint Maarten (Dutch part)Slovak RepublicSloveniaSmall statesSolomon IslandsSomaliaSouth AfricaSouth AsiaSouth Asia (IDA & IBRD)South SudanSpainSri LankaSt. Kitts and NevisSt. LuciaSt. Martin (French part)St. Vincent and the GrenadinesSub-Saharan Africa Sub-Saharan Africa (excluding high income)Sub-Saharan Africa (IDA & IBRD countries)SudanSurinameSwazilandSwedenSwitzerlandSyrian Arab RepublicTajikistanTanzaniaThailandTimor-LesteTogoTongaTrinidad and TobagoTunisiaTurkeyTurkmenistanUgandaUkraineUnited Arab EmiratesUnited KingdomUnited StatesUpper middle incomeUruguayUzbekistanVanuatuVenezuela, RBVietnamVirgin Islands (U.S.)West Bank and GazaWorldYemen, Rep.ZambiaZimbabwe Linea del tempo:
Questa scala temporale mostra un grafico dal 1961 anno al 2015 anno. Saudi Arabia. I dati fino ad 1960 anno non disponibili. Il numero di osservazioni attuali secondo i date: 55.
La fonte (nome):
Indicatori dello sviluppo mondiale
La fonte (organizzazione):
(1) United Nations Population Division. World Population Prospects, (2) Census reports and other statistical publications from national statistical offices, (3) Eurostat: Demographic Statistics, (4) United Nations Statistical Division. Population and Vital Statistics Reprot (various years), (5) U.S. Census Bureau: International Database, and (6) Secretariat of the Pacific Community: Statistics and Demography Programme.
Categorie:
Health
sono stati aggiornati
23 apr 2017 anni
Indicatori delle variazioni dei valori per anni
Minima:
3.392
1 gen 2013 anni
Massimo:
20.319
1 gen 1961 anni
Alla data di osservazione
Valore
Variazione assoluta
La variazione rispetto al valore precedente
1 gen 1961 anni
20.319
+20.319
0.0%
1 gen 1962 anni
19.934
-0.385
-1.89%
1 gen 1963 anni
19.537
-0.397
-1.99%
1 gen 1964 anni
19.12
-0.417
-2.13%
1 gen 1965 anni
18.677
-0.443
-2.32%
1 gen 1966 anni
18.195
-0.482
-2.58%
1 gen 1967 anni
17.665
-0.53
-2.91%
1 gen 1968 anni
17.083
-0.582
-3.29%
1 gen 1969 anni
16.453
-0.63
-3.69%
1 gen 1970 anni
15.779
-0.674
-4.1%
1 gen 1971 anni
15.067
-0.712
-4.51%
1 gen 1972 anni
14.325
-0.742
-4.92%
1 gen 1973 anni
13.568
-0.757
-5.28%
1 gen 1974 anni
12.811
-0.757
-5.58%
1 gen 1975 anni
12.067
-0.744
-5.81%
1 gen 1976 anni
11.349
-0.718
-5.95%
1 gen 1977 anni
10.664
-0.685
-6.04%
1 gen 1978 anni
10.014
-0.65
-6.1%
1 gen 1979 anni
9.401
-0.613
-6.12%
1 gen 1980 anni
8.828
-0.573
-6.1%
1 gen 1981 anni
8.297
-0.531
-6.01%
1 gen 1982 anni
7.808
-0.489
-5.89%
1 gen 1983 anni
7.356
-0.452
-5.79%
1 gen 1984 anni
6.937
-0.419
-5.7%
1 gen 1985 anni
6.55
-0.387
-5.58%
1 gen 1986 anni
6.195
-0.355
-5.42%
1 gen 1987 anni
5.875
-0.32
-5.17%
1 gen 1988 anni
5.589
-0.286
-4.87%
1 gen 1989 anni
5.337
-0.252
-4.51%
1 gen 1990 anni
5.114
-0.223
-4.18%
1 gen 1991 anni
4.917
-0.197
-3.85%
1 gen 1992 anni
4.742
-0.175
-3.56%
1 gen 1993 anni
4.585
-0.157
-3.31%
1 gen 1994 anni
4.441
-0.144
-3.14%
1 gen 1995 anni
4.307
-0.134
-3.02%
1 gen 1996 anni
4.181
-0.126
-2.93%
1 gen 1997 anni
4.062
-0.119
-2.85%
1 gen 1998 anni
3.954
-0.108
-2.66%
1 gen 1999 anni
3.855
-0.099
-2.5%
1 gen 2000 anni
3.768
-0.087
-2.26%
1 gen 2001 anni
3.692
-0.076
-2.02%
1 gen 2002 anni
3.628
-0.064
-1.73%
1 gen 2003 anni
3.577
-0.051
-1.41%
1 gen 2004 anni
3.537
-0.04
-1.12%
1 gen 2005 anni
3.508
-0.029
-0.82%
1 gen 2006 anni
3.486
-0.022
-0.63%
1 gen 2007 anni
3.469
-0.017
-0.49%
1 gen 2008 anni
3.453
-0.016
-0.46%
1 gen 2009 anni
3.439
-0.014
-0.41%
1 gen 2010 anni
3.425
-0.014
-0.41%
1 gen 2011 anni
3.411
-0.014
-0.41%
1 gen 2012 anni
3.399
-0.012
-0.35%
1 gen 2013 anni
3.392
-0.007
-0.21%
1 gen 2014 anni
3.392
0.0
0.0%
1 gen 2015 anni
3.4
+0.008
0.24%
Classificazione dei paesi secondo i statistiche attuali per anni


Commenti: