29
/it/
it
AIzaSyAYiBZKx7MnpbEhh9jyipgxe19OcubqV5w
April 1, 2024
34867
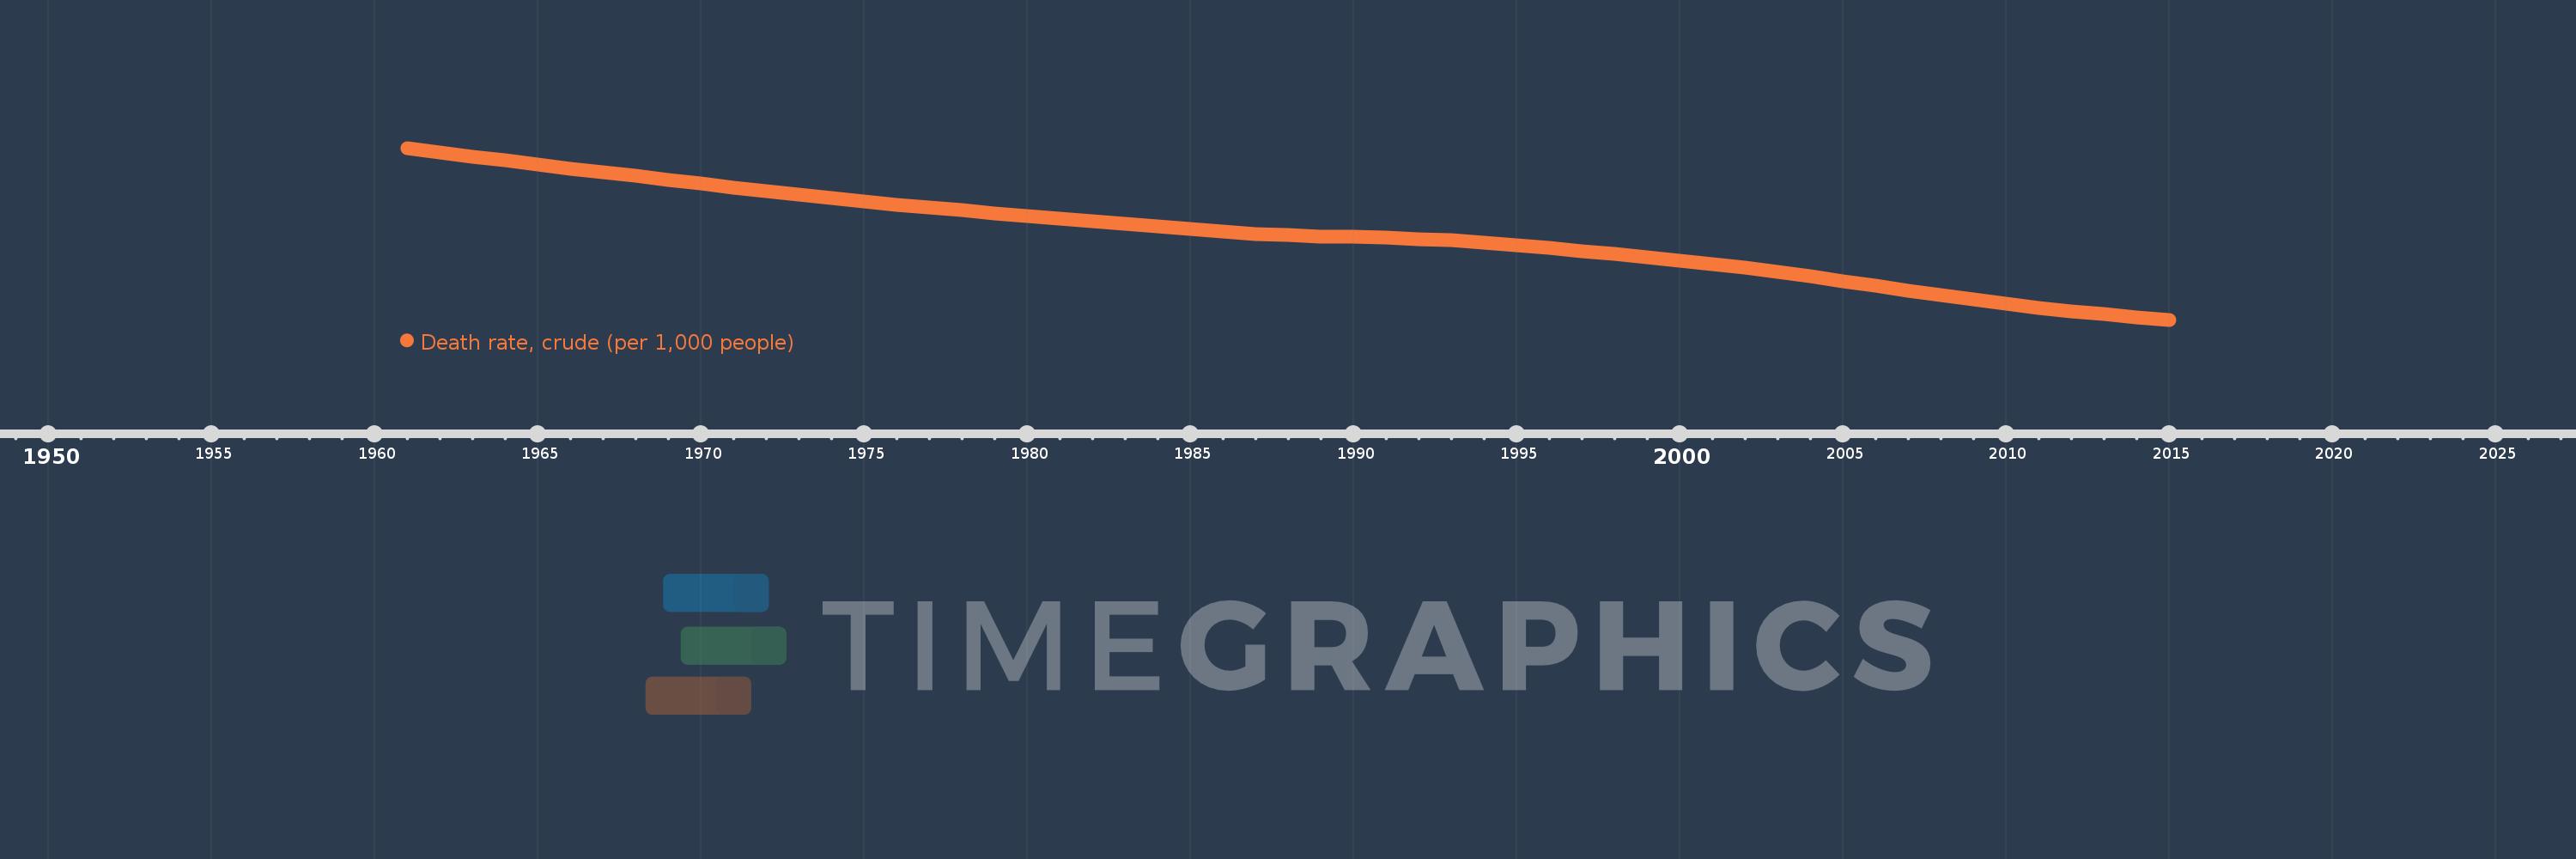
Heavily indebted poor countries (HIPC)
HPC
false
2
1
Death rate, crude (per 1,000 people)
2015,2014,2013,2012,2011,2010,2009,2008,2007,2006,2005,2004,2003,2002,2001,2000,1999,1998,1997,1996,1995,1994,1993,1992,1991,1990,1989,1988,1987,1986,1985,1984,1983,1982,1981,1980,1979,1978,1977,1976,1975,1974,1973,1972,1971,1970,1969,1968,1967,1966,1965,1964,1963,1962,1961
Queste statistiche in altri paesi:
AfghanistanAlbaniaAlgeriaAmerican SamoaAndorraAngolaAntigua and BarbudaArab WorldArgentinaArmeniaArubaAustraliaAustriaAzerbaijanBahamas, TheBahrainBangladeshBarbadosBelarusBelgiumBelizeBeninBermudaBhutanBoliviaBosnia and HerzegovinaBotswanaBrazilBrunei DarussalamBulgariaBurkina FasoBurundiCabo VerdeCambodiaCameroonCanadaCaribbean small statesCayman IslandsCentral African RepublicCentral Europe and the BalticsChadChannel IslandsChileChinaColombiaComorosCongo, Dem. Rep.Congo, Rep.Costa RicaCote d'IvoireCroatiaCubaCuracaoCyprusCzech RepublicDenmarkDjiboutiDominicaDominican RepublicEarly-demographic dividendEast Asia & PacificEast Asia & Pacific (excluding high income)East Asia & Pacific (IDA & IBRD countries)EcuadorEgypt, Arab Rep.El SalvadorEquatorial GuineaEritreaEstoniaEthiopiaEuro areaEurope & Central AsiaEurope & Central Asia (excluding high income)Europe & Central Asia (IDA & IBRD countries)European UnionFaroe IslandsFijiFinlandFragile and conflict affected situationsFranceFrench PolynesiaGabonGambia, TheGeorgiaGermanyGhanaGreeceGreenlandGrenadaGuamGuatemalaGuineaGuinea-BissauGuyanaHaitiHeavily indebted poor countries (HIPC)High incomeHondurasHong Kong SAR, ChinaHungaryIBRD onlyIcelandIDA & IBRD totalIDA blendIDA onlyIDA totalIndiaIndonesiaIran, Islamic Rep.IraqIrelandIsle of ManIsraelItalyJamaicaJapanJordanKazakhstanKenyaKiribatiKorea, Dem. People’s Rep.Korea, Rep.KosovoKuwaitKyrgyz RepublicLao PDRLate-demographic dividendLatin America & Caribbean Latin America & Caribbean (excluding high income)Latin America & the Caribbean (IDA & IBRD countries)LatviaLeast developed countries: UN classificationLebanonLesothoLiberiaLibyaLiechtensteinLithuaniaLow & middle incomeLow incomeLower middle incomeLuxembourgMacao SAR, ChinaMacedonia, FYRMadagascarMalawiMalaysiaMaldivesMaliMaltaMarshall IslandsMauritaniaMauritiusMexicoMicronesia, Fed. Sts.Middle East & North AfricaMiddle East & North Africa (excluding high income)Middle East & North Africa (IDA & IBRD countries)Middle incomeMoldovaMonacoMongoliaMontenegroMoroccoMozambiqueMyanmarNamibiaNepalNetherlandsNew CaledoniaNew ZealandNicaraguaNigerNigeriaNorth AmericaNorwayOECD membersOmanOther small statesPacific island small statesPakistanPalauPanamaPapua New GuineaParaguayPeruPhilippinesPolandPortugalPost-demographic dividendPre-demographic dividendPuerto RicoQatarRomaniaRussian FederationRwandaSamoaSan MarinoSao Tome and PrincipeSaudi ArabiaSenegalSerbiaSeychellesSierra LeoneSingaporeSint Maarten (Dutch part)Slovak RepublicSloveniaSmall statesSolomon IslandsSomaliaSouth AfricaSouth AsiaSouth Asia (IDA & IBRD)South SudanSpainSri LankaSt. Kitts and NevisSt. LuciaSt. Martin (French part)St. Vincent and the GrenadinesSub-Saharan Africa Sub-Saharan Africa (excluding high income)Sub-Saharan Africa (IDA & IBRD countries)SudanSurinameSwazilandSwedenSwitzerlandSyrian Arab RepublicTajikistanTanzaniaThailandTimor-LesteTogoTongaTrinidad and TobagoTunisiaTurkeyTurkmenistanUgandaUkraineUnited Arab EmiratesUnited KingdomUnited StatesUpper middle incomeUruguayUzbekistanVanuatuVenezuela, RBVietnamVirgin Islands (U.S.)West Bank and GazaWorldYemen, Rep.ZambiaZimbabwe Linea del tempo:
Questa scala temporale mostra un grafico dal 1961 anno al 2015 anno. Heavily indebted poor countries (HIPC). I dati fino ad 1960 anno non disponibili. Il numero di osservazioni attuali secondo i date: 55.
La fonte (nome):
Indicatori dello sviluppo mondiale
La fonte (organizzazione):
(1) United Nations Population Division. World Population Prospects, (2) Census reports and other statistical publications from national statistical offices, (3) Eurostat: Demographic Statistics, (4) United Nations Statistical Division. Population and Vital Statistics Reprot (various years), (5) U.S. Census Bureau: International Database, and (6) Secretariat of the Pacific Community: Statistics and Demography Programme.
Categorie:
Health
sono stati aggiornati
23 apr 2017 anni
Indicatori delle variazioni dei valori per anni
Minima:
9.018
1 gen 2015 anni
Massimo:
24.753
1 gen 1961 anni
Alla data di osservazione
Valore
Variazione assoluta
La variazione rispetto al valore precedente
1 gen 1961 anni
24.753
+24.753
0.0%
1 gen 1962 anni
24.353
-0.4
-1.62%
1 gen 1963 anni
23.966
-0.387
-1.59%
1 gen 1964 anni
23.592
-0.375
-1.56%
1 gen 1965 anni
23.228
-0.364
-1.54%
1 gen 1966 anni
22.873
-0.355
-1.53%
1 gen 1967 anni
22.523
-0.35
-1.53%
1 gen 1968 anni
22.176
-0.347
-1.54%
1 gen 1969 anni
21.832
-0.344
-1.55%
1 gen 1970 anni
21.489
-0.343
-1.57%
1 gen 1971 anni
21.149
-0.34
-1.58%
1 gen 1972 anni
20.814
-0.335
-1.59%
1 gen 1973 anni
20.486
-0.328
-1.58%
1 gen 1974 anni
20.168
-0.318
-1.55%
1 gen 1975 anni
19.862
-0.306
-1.52%
1 gen 1976 anni
19.57
-0.292
-1.47%
1 gen 1977 anni
19.293
-0.277
-1.41%
1 gen 1978 anni
19.03
-0.263
-1.36%
1 gen 1979 anni
18.778
-0.252
-1.33%
1 gen 1980 anni
18.534
-0.244
-1.3%
1 gen 1981 anni
18.293
-0.241
-1.3%
1 gen 1982 anni
18.051
-0.243
-1.33%
1 gen 1983 anni
17.805
-0.246
-1.36%
1 gen 1984 anni
17.559
-0.246
-1.38%
1 gen 1985 anni
17.316
-0.243
-1.38%
1 gen 1986 anni
17.091
-0.225
-1.3%
1 gen 1987 anni
16.9
-0.19
-1.11%
1 gen 1988 anni
16.755
-0.145
-0.86%
1 gen 1989 anni
16.655
-0.1
-0.59%
1 gen 1990 anni
16.588
-0.068
-0.41%
1 gen 1991 anni
16.523
-0.065
-0.39%
1 gen 1992 anni
16.426
-0.097
-0.59%
1 gen 1993 anni
16.278
-0.149
-0.9%
1 gen 1994 anni
16.079
-0.198
-1.22%
1 gen 1995 anni
15.848
-0.232
-1.44%
1 gen 1996 anni
15.596
-0.252
-1.59%
1 gen 1997 anni
15.327
-0.269
-1.72%
1 gen 1998 anni
15.042
-0.285
-1.86%
1 gen 1999 anni
14.743
-0.299
-1.99%
1 gen 2000 anni
14.431
-0.312
-2.12%
1 gen 2001 anni
14.104
-0.327
-2.26%
1 gen 2002 anni
13.757
-0.347
-2.46%
1 gen 2003 anni
13.384
-0.373
-2.71%
1 gen 2004 anni
12.984
-0.401
-2.99%
1 gen 2005 anni
12.562
-0.422
-3.25%
1 gen 2006 anni
12.126
-0.436
-3.47%
1 gen 2007 anni
11.687
-0.439
-3.62%
1 gen 2008 anni
11.257
-0.43
-3.68%
1 gen 2009 anni
10.848
-0.41
-3.64%
1 gen 2010 anni
10.465
-0.383
-3.53%
1 gen 2011 anni
10.116
-0.35
-3.34%
1 gen 2012 anni
9.801
-0.315
-3.11%
1 gen 2013 anni
9.516
-0.285
-2.91%
1 gen 2014 anni
9.255
-0.26
-2.73%
1 gen 2015 anni
9.018
-0.237
-2.56%
Classificazione dei paesi secondo i statistiche attuali per anni


Commenti: