29
/it/
it
AIzaSyAYiBZKx7MnpbEhh9jyipgxe19OcubqV5w
April 1, 2024
116738
Cyprus
CYP
true
2
1
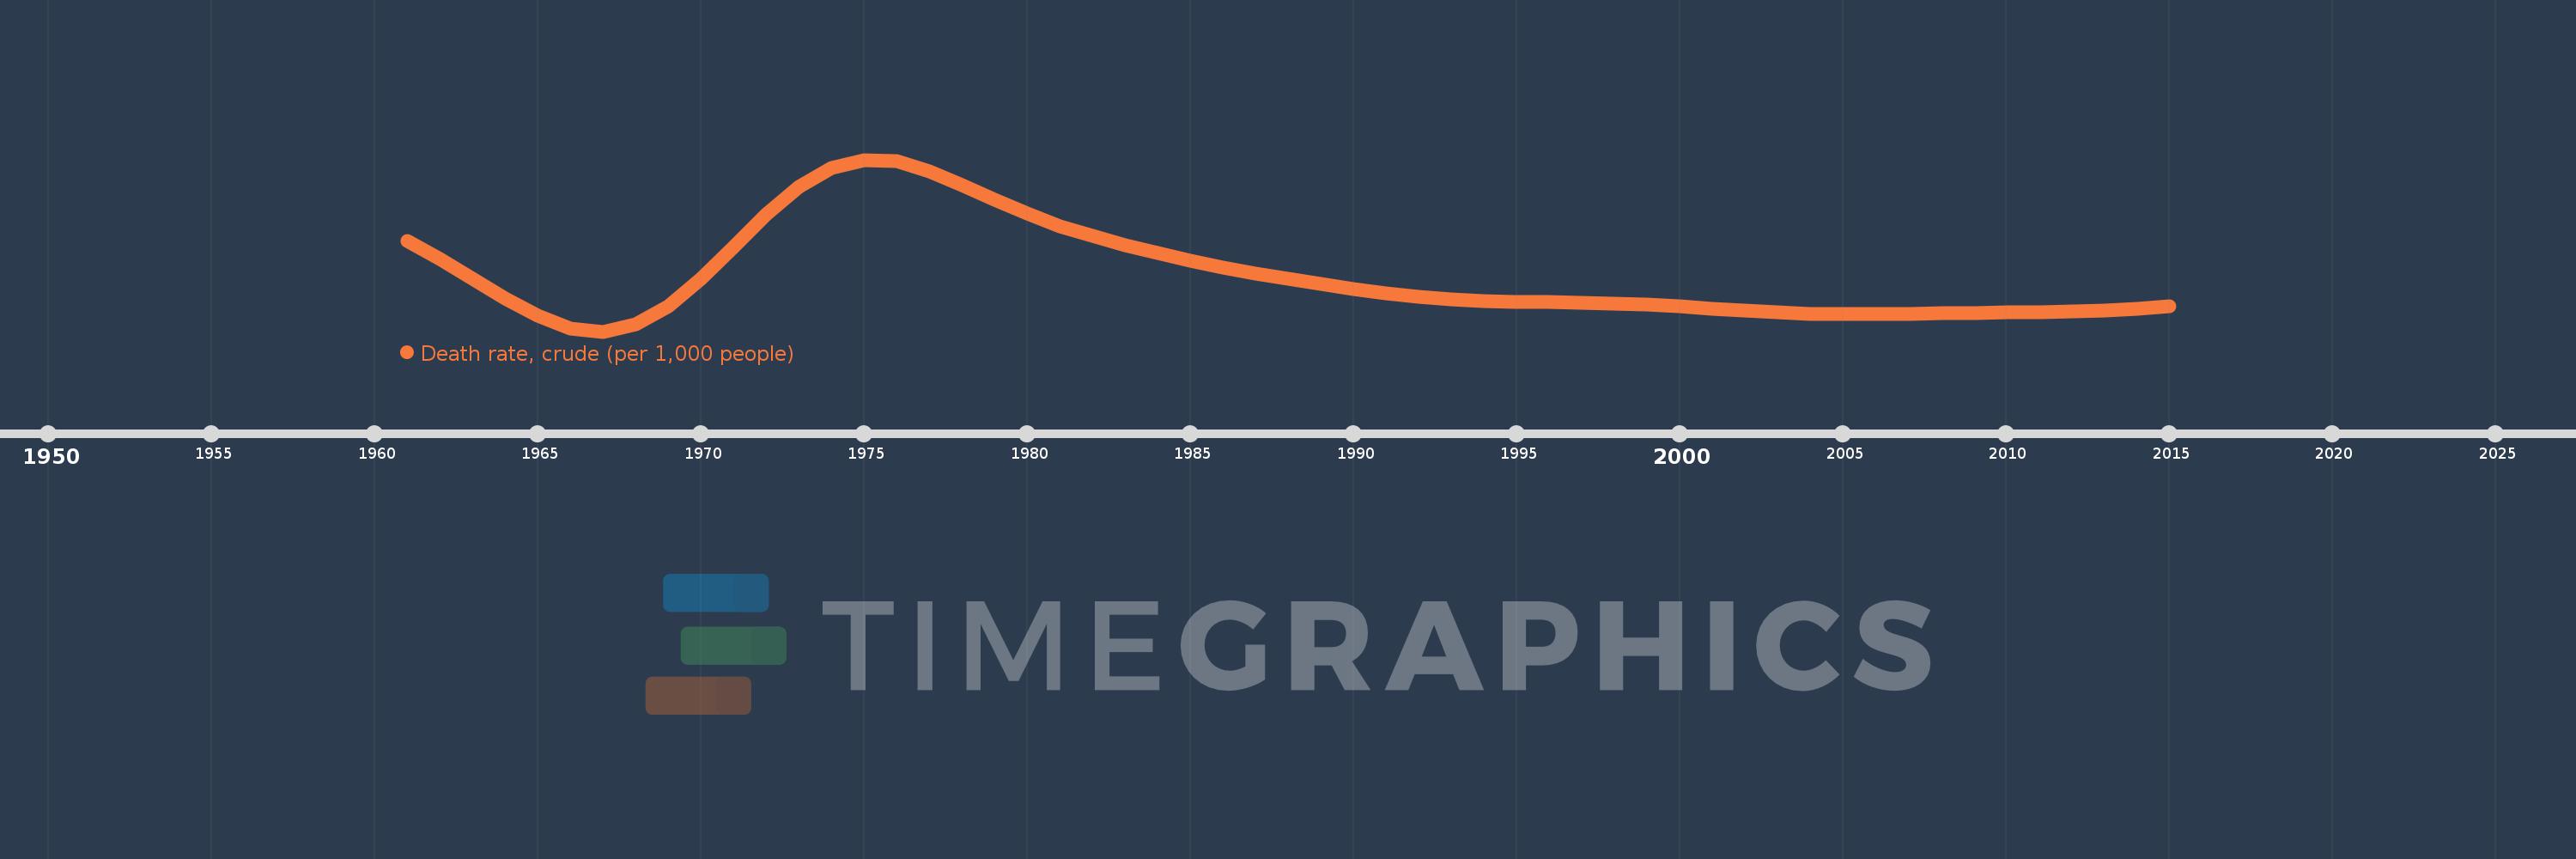
Death rate, crude (per 1,000 people)
2015,2014,2013,2012,2011,2010,2009,2008,2007,2006,2005,2004,2003,2002,2001,2000,1999,1998,1997,1996,1995,1994,1993,1992,1991,1990,1989,1988,1987,1986,1985,1984,1983,1982,1981,1980,1979,1978,1977,1976,1975,1974,1973,1972,1971,1970,1969,1968,1967,1966,1965,1964,1963,1962,1961
Queste statistiche in altri paesi:
AfghanistanAlbaniaAlgeriaAmerican SamoaAndorraAngolaAntigua and BarbudaArab WorldArgentinaArmeniaArubaAustraliaAustriaAzerbaijanBahamas, TheBahrainBangladeshBarbadosBelarusBelgiumBelizeBeninBermudaBhutanBoliviaBosnia and HerzegovinaBotswanaBrazilBrunei DarussalamBulgariaBurkina FasoBurundiCabo VerdeCambodiaCameroonCanadaCaribbean small statesCayman IslandsCentral African RepublicCentral Europe and the BalticsChadChannel IslandsChileChinaColombiaComorosCongo, Dem. Rep.Congo, Rep.Costa RicaCote d'IvoireCroatiaCubaCuracaoCyprusCzech RepublicDenmarkDjiboutiDominicaDominican RepublicEarly-demographic dividendEast Asia & PacificEast Asia & Pacific (excluding high income)East Asia & Pacific (IDA & IBRD countries)EcuadorEgypt, Arab Rep.El SalvadorEquatorial GuineaEritreaEstoniaEthiopiaEuro areaEurope & Central AsiaEurope & Central Asia (excluding high income)Europe & Central Asia (IDA & IBRD countries)European UnionFaroe IslandsFijiFinlandFragile and conflict affected situationsFranceFrench PolynesiaGabonGambia, TheGeorgiaGermanyGhanaGreeceGreenlandGrenadaGuamGuatemalaGuineaGuinea-BissauGuyanaHaitiHeavily indebted poor countries (HIPC)High incomeHondurasHong Kong SAR, ChinaHungaryIBRD onlyIcelandIDA & IBRD totalIDA blendIDA onlyIDA totalIndiaIndonesiaIran, Islamic Rep.IraqIrelandIsle of ManIsraelItalyJamaicaJapanJordanKazakhstanKenyaKiribatiKorea, Dem. People’s Rep.Korea, Rep.KosovoKuwaitKyrgyz RepublicLao PDRLate-demographic dividendLatin America & Caribbean Latin America & Caribbean (excluding high income)Latin America & the Caribbean (IDA & IBRD countries)LatviaLeast developed countries: UN classificationLebanonLesothoLiberiaLibyaLiechtensteinLithuaniaLow & middle incomeLow incomeLower middle incomeLuxembourgMacao SAR, ChinaMacedonia, FYRMadagascarMalawiMalaysiaMaldivesMaliMaltaMarshall IslandsMauritaniaMauritiusMexicoMicronesia, Fed. Sts.Middle East & North AfricaMiddle East & North Africa (excluding high income)Middle East & North Africa (IDA & IBRD countries)Middle incomeMoldovaMonacoMongoliaMontenegroMoroccoMozambiqueMyanmarNamibiaNepalNetherlandsNew CaledoniaNew ZealandNicaraguaNigerNigeriaNorth AmericaNorwayOECD membersOmanOther small statesPacific island small statesPakistanPalauPanamaPapua New GuineaParaguayPeruPhilippinesPolandPortugalPost-demographic dividendPre-demographic dividendPuerto RicoQatarRomaniaRussian FederationRwandaSamoaSan MarinoSao Tome and PrincipeSaudi ArabiaSenegalSerbiaSeychellesSierra LeoneSingaporeSint Maarten (Dutch part)Slovak RepublicSloveniaSmall statesSolomon IslandsSomaliaSouth AfricaSouth AsiaSouth Asia (IDA & IBRD)South SudanSpainSri LankaSt. Kitts and NevisSt. LuciaSt. Martin (French part)St. Vincent and the GrenadinesSub-Saharan Africa Sub-Saharan Africa (excluding high income)Sub-Saharan Africa (IDA & IBRD countries)SudanSurinameSwazilandSwedenSwitzerlandSyrian Arab RepublicTajikistanTanzaniaThailandTimor-LesteTogoTongaTrinidad and TobagoTunisiaTurkeyTurkmenistanUgandaUkraineUnited Arab EmiratesUnited KingdomUnited StatesUpper middle incomeUruguayUzbekistanVanuatuVenezuela, RBVietnamVirgin Islands (U.S.)West Bank and GazaWorldYemen, Rep.ZambiaZimbabwe Linea del tempo:
Questa scala temporale mostra un grafico dal 1961 anno al 2015 anno. Cyprus. I dati fino ad 1960 anno non disponibili. Il numero di osservazioni attuali secondo i date: 55.
La fonte (nome):
Indicatori dello sviluppo mondiale
La fonte (organizzazione):
(1) United Nations Population Division. World Population Prospects, (2) Census reports and other statistical publications from national statistical offices, (3) Eurostat: Demographic Statistics, (4) United Nations Statistical Division. Population and Vital Statistics Reprot (various years), (5) U.S. Census Bureau: International Database, and (6) Secretariat of the Pacific Community: Statistics and Demography Programme.
Categorie:
Health
sono stati aggiornati
23 apr 2017 anni
Indicatori delle variazioni dei valori per anni
Minima:
6.612
1 gen 1967 anni
Massimo:
8.299
1 gen 1975 anni
Alla data di osservazione
Valore
Variazione assoluta
La variazione rispetto al valore precedente
1 gen 1961 anni
7.506
+7.506
0.0%
1 gen 1962 anni
7.324
-0.182
-2.42%
1 gen 1963 anni
7.132
-0.192
-2.62%
1 gen 1964 anni
6.94
-0.192
-2.69%
1 gen 1965 anni
6.766
-0.174
-2.51%
1 gen 1966 anni
6.644
-0.122
-1.8%
1 gen 1967 anni
6.612
-0.032
-0.48%
1 gen 1968 anni
6.686
+0.074
1.12%
1 gen 1969 anni
6.863
+0.177
2.65%
1 gen 1970 anni
7.129
+0.266
3.88%
1 gen 1971 anni
7.445
+0.316
4.43%
1 gen 1972 anni
7.763
+0.318
4.27%
1 gen 1973 anni
8.031
+0.268
3.45%
1 gen 1974 anni
8.215
+0.184
2.29%
1 gen 1975 anni
8.299
+0.084
1.02%
1 gen 1976 anni
8.285
-0.014
-0.17%
1 gen 1977 anni
8.189
-0.096
-1.16%
1 gen 1978 anni
8.051
-0.138
-1.69%
1 gen 1979 anni
7.906
-0.145
-1.8%
1 gen 1980 anni
7.768
-0.138
-1.75%
1 gen 1981 anni
7.649
-0.119
-1.53%
1 gen 1982 anni
7.549
-0.1
-1.31%
1 gen 1983 anni
7.462
-0.087
-1.15%
1 gen 1984 anni
7.382
-0.08
-1.07%
1 gen 1985 anni
7.309
-0.073
-0.99%
1 gen 1986 anni
7.244
-0.065
-0.89%
1 gen 1987 anni
7.184
-0.06
-0.83%
1 gen 1988 anni
7.129
-0.055
-0.77%
1 gen 1989 anni
7.078
-0.051
-0.72%
1 gen 1990 anni
7.03
-0.048
-0.68%
1 gen 1991 anni
6.988
-0.042
-0.6%
1 gen 1992 anni
6.954
-0.034
-0.49%
1 gen 1993 anni
6.929
-0.025
-0.36%
1 gen 1994 anni
6.912
-0.017
-0.25%
1 gen 1995 anni
6.903
-0.009
-0.13%
1 gen 1996 anni
6.899
-0.004
-0.06%
1 gen 1997 anni
6.895
-0.004
-0.06%
1 gen 1998 anni
6.888
-0.007
-0.1%
1 gen 1999 anni
6.875
-0.013
-0.19%
1 gen 2000 anni
6.858
-0.017
-0.25%
1 gen 2001 anni
6.837
-0.021
-0.31%
1 gen 2002 anni
6.816
-0.021
-0.31%
1 gen 2003 anni
6.798
-0.018
-0.26%
1 gen 2004 anni
6.787
-0.011
-0.16%
1 gen 2005 anni
6.783
-0.004
-0.06%
1 gen 2006 anni
6.784
+0.001
0.01%
1 gen 2007 anni
6.789
+0.005
0.07%
1 gen 2008 anni
6.793
+0.004
0.06%
1 gen 2009 anni
6.797
+0.004
0.06%
1 gen 2010 anni
6.799
+0.002
0.03%
1 gen 2011 anni
6.802
+0.003
0.04%
1 gen 2012 anni
6.807
+0.005
0.07%
1 gen 2013 anni
6.818
+0.011
0.16%
1 gen 2014 anni
6.836
+0.018
0.26%
1 gen 2015 anni
6.863
+0.027
0.39%
Classificazione dei paesi secondo i statistiche attuali per anni


Commenti: