29
/it/
it
AIzaSyAYiBZKx7MnpbEhh9jyipgxe19OcubqV5w
April 1, 2024
63390
Afghanistan
AFG
true
2
1
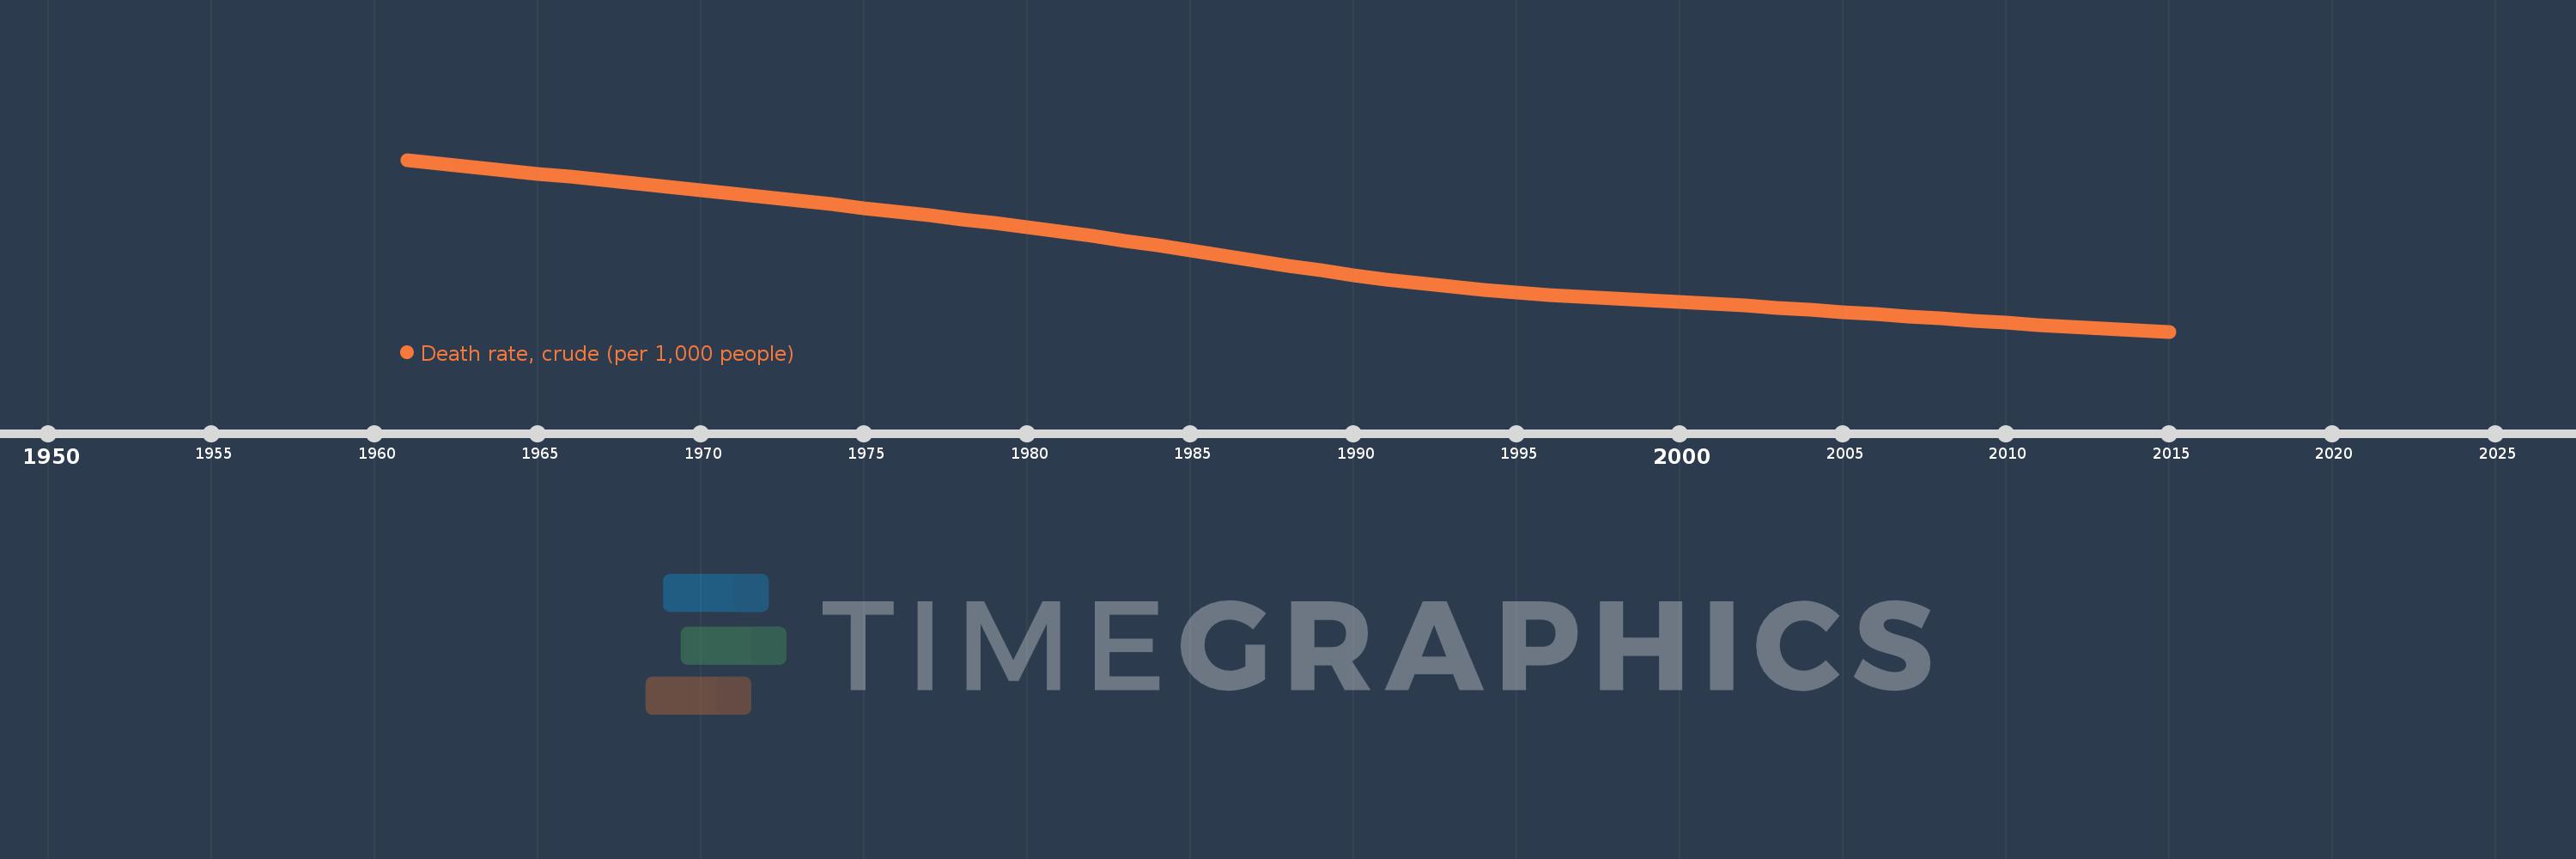
Death rate, crude (per 1,000 people)
2015,2014,2013,2012,2011,2010,2009,2008,2007,2006,2005,2004,2003,2002,2001,2000,1999,1998,1997,1996,1995,1994,1993,1992,1991,1990,1989,1988,1987,1986,1985,1984,1983,1982,1981,1980,1979,1978,1977,1976,1975,1974,1973,1972,1971,1970,1969,1968,1967,1966,1965,1964,1963,1962,1961
Queste statistiche in altri paesi:
AfghanistanAlbaniaAlgeriaAmerican SamoaAndorraAngolaAntigua and BarbudaArab WorldArgentinaArmeniaArubaAustraliaAustriaAzerbaijanBahamas, TheBahrainBangladeshBarbadosBelarusBelgiumBelizeBeninBermudaBhutanBoliviaBosnia and HerzegovinaBotswanaBrazilBrunei DarussalamBulgariaBurkina FasoBurundiCabo VerdeCambodiaCameroonCanadaCaribbean small statesCayman IslandsCentral African RepublicCentral Europe and the BalticsChadChannel IslandsChileChinaColombiaComorosCongo, Dem. Rep.Congo, Rep.Costa RicaCote d'IvoireCroatiaCubaCuracaoCyprusCzech RepublicDenmarkDjiboutiDominicaDominican RepublicEarly-demographic dividendEast Asia & PacificEast Asia & Pacific (excluding high income)East Asia & Pacific (IDA & IBRD countries)EcuadorEgypt, Arab Rep.El SalvadorEquatorial GuineaEritreaEstoniaEthiopiaEuro areaEurope & Central AsiaEurope & Central Asia (excluding high income)Europe & Central Asia (IDA & IBRD countries)European UnionFaroe IslandsFijiFinlandFragile and conflict affected situationsFranceFrench PolynesiaGabonGambia, TheGeorgiaGermanyGhanaGreeceGreenlandGrenadaGuamGuatemalaGuineaGuinea-BissauGuyanaHaitiHeavily indebted poor countries (HIPC)High incomeHondurasHong Kong SAR, ChinaHungaryIBRD onlyIcelandIDA & IBRD totalIDA blendIDA onlyIDA totalIndiaIndonesiaIran, Islamic Rep.IraqIrelandIsle of ManIsraelItalyJamaicaJapanJordanKazakhstanKenyaKiribatiKorea, Dem. People’s Rep.Korea, Rep.KosovoKuwaitKyrgyz RepublicLao PDRLate-demographic dividendLatin America & Caribbean Latin America & Caribbean (excluding high income)Latin America & the Caribbean (IDA & IBRD countries)LatviaLeast developed countries: UN classificationLebanonLesothoLiberiaLibyaLiechtensteinLithuaniaLow & middle incomeLow incomeLower middle incomeLuxembourgMacao SAR, ChinaMacedonia, FYRMadagascarMalawiMalaysiaMaldivesMaliMaltaMarshall IslandsMauritaniaMauritiusMexicoMicronesia, Fed. Sts.Middle East & North AfricaMiddle East & North Africa (excluding high income)Middle East & North Africa (IDA & IBRD countries)Middle incomeMoldovaMonacoMongoliaMontenegroMoroccoMozambiqueMyanmarNamibiaNepalNetherlandsNew CaledoniaNew ZealandNicaraguaNigerNigeriaNorth AmericaNorwayOECD membersOmanOther small statesPacific island small statesPakistanPalauPanamaPapua New GuineaParaguayPeruPhilippinesPolandPortugalPost-demographic dividendPre-demographic dividendPuerto RicoQatarRomaniaRussian FederationRwandaSamoaSan MarinoSao Tome and PrincipeSaudi ArabiaSenegalSerbiaSeychellesSierra LeoneSingaporeSint Maarten (Dutch part)Slovak RepublicSloveniaSmall statesSolomon IslandsSomaliaSouth AfricaSouth AsiaSouth Asia (IDA & IBRD)South SudanSpainSri LankaSt. Kitts and NevisSt. LuciaSt. Martin (French part)St. Vincent and the GrenadinesSub-Saharan Africa Sub-Saharan Africa (excluding high income)Sub-Saharan Africa (IDA & IBRD countries)SudanSurinameSwazilandSwedenSwitzerlandSyrian Arab RepublicTajikistanTanzaniaThailandTimor-LesteTogoTongaTrinidad and TobagoTunisiaTurkeyTurkmenistanUgandaUkraineUnited Arab EmiratesUnited KingdomUnited StatesUpper middle incomeUruguayUzbekistanVanuatuVenezuela, RBVietnamVirgin Islands (U.S.)West Bank and GazaWorldYemen, Rep.ZambiaZimbabwe Linea del tempo:
Questa scala temporale mostra un grafico dal 1961 anno al 2015 anno. Afghanistan. I dati fino ad 1960 anno non disponibili. Il numero di osservazioni attuali secondo i date: 55.
La fonte (nome):
Indicatori dello sviluppo mondiale
La fonte (organizzazione):
(1) United Nations Population Division. World Population Prospects, (2) Census reports and other statistical publications from national statistical offices, (3) Eurostat: Demographic Statistics, (4) United Nations Statistical Division. Population and Vital Statistics Reprot (various years), (5) U.S. Census Bureau: International Database, and (6) Secretariat of the Pacific Community: Statistics and Demography Programme.
Categorie:
Health
sono stati aggiornati
23 apr 2017 anni
Indicatori delle variazioni dei valori per anni
Minima:
8.23
1 gen 2015 anni
Massimo:
32.403
1 gen 1961 anni
Alla data di osservazione
Valore
Variazione assoluta
La variazione rispetto al valore precedente
1 gen 1961 anni
32.403
+32.403
0.0%
1 gen 1962 anni
31.902
-0.501
-1.55%
1 gen 1963 anni
31.415
-0.487
-1.53%
1 gen 1964 anni
30.937
-0.478
-1.52%
1 gen 1965 anni
30.464
-0.473
-1.53%
1 gen 1966 anni
29.992
-0.472
-1.55%
1 gen 1967 anni
29.521
-0.471
-1.57%
1 gen 1968 anni
29.05
-0.471
-1.6%
1 gen 1969 anni
28.577
-0.473
-1.63%
1 gen 1970 anni
28.101
-0.476
-1.67%
1 gen 1971 anni
27.619
-0.482
-1.72%
1 gen 1972 anni
27.131
-0.488
-1.77%
1 gen 1973 anni
26.637
-0.494
-1.82%
1 gen 1974 anni
26.136
-0.501
-1.88%
1 gen 1975 anni
25.625
-0.511
-1.96%
1 gen 1976 anni
25.104
-0.521
-2.03%
1 gen 1977 anni
24.57
-0.534
-2.13%
1 gen 1978 anni
24.024
-0.546
-2.22%
1 gen 1979 anni
23.464
-0.56
-2.33%
1 gen 1980 anni
22.887
-0.577
-2.46%
1 gen 1981 anni
22.288
-0.599
-2.62%
1 gen 1982 anni
21.662
-0.626
-2.81%
1 gen 1983 anni
21.008
-0.654
-3.02%
1 gen 1984 anni
20.329
-0.679
-3.23%
1 gen 1985 anni
19.633
-0.696
-3.42%
1 gen 1986 anni
18.925
-0.708
-3.61%
1 gen 1987 anni
18.212
-0.713
-3.77%
1 gen 1988 anni
17.505
-0.707
-3.88%
1 gen 1989 anni
16.818
-0.687
-3.92%
1 gen 1990 anni
16.163
-0.655
-3.89%
1 gen 1991 anni
15.555
-0.608
-3.76%
1 gen 1992 anni
15.008
-0.547
-3.52%
1 gen 1993 anni
14.524
-0.484
-3.22%
1 gen 1994 anni
14.101
-0.423
-2.91%
1 gen 1995 anni
13.736
-0.365
-2.59%
1 gen 1996 anni
13.421
-0.315
-2.29%
1 gen 1997 anni
13.146
-0.275
-2.05%
1 gen 1998 anni
12.894
-0.252
-1.92%
1 gen 1999 anni
12.651
-0.243
-1.88%
1 gen 2000 anni
12.406
-0.245
-1.94%
1 gen 2001 anni
12.149
-0.257
-2.07%
1 gen 2002 anni
11.878
-0.271
-2.23%
1 gen 2003 anni
11.594
-0.284
-2.39%
1 gen 2004 anni
11.302
-0.292
-2.52%
1 gen 2005 anni
11.003
-0.299
-2.65%
1 gen 2006 anni
10.696
-0.307
-2.79%
1 gen 2007 anni
10.386
-0.31
-2.9%
1 gen 2008 anni
10.075
-0.311
-2.99%
1 gen 2009 anni
9.771
-0.304
-3.02%
1 gen 2010 anni
9.475
-0.296
-3.03%
1 gen 2011 anni
9.193
-0.282
-2.98%
1 gen 2012 anni
8.927
-0.266
-2.89%
1 gen 2013 anni
8.677
-0.25
-2.8%
1 gen 2014 anni
8.445
-0.232
-2.67%
1 gen 2015 anni
8.23
-0.215
-2.55%
Classificazione dei paesi secondo i statistiche attuali per anni


Commenti: