29
/it/
it
AIzaSyAYiBZKx7MnpbEhh9jyipgxe19OcubqV5w
April 1, 2024
173965
Lao PDR
LAO
true
2
1
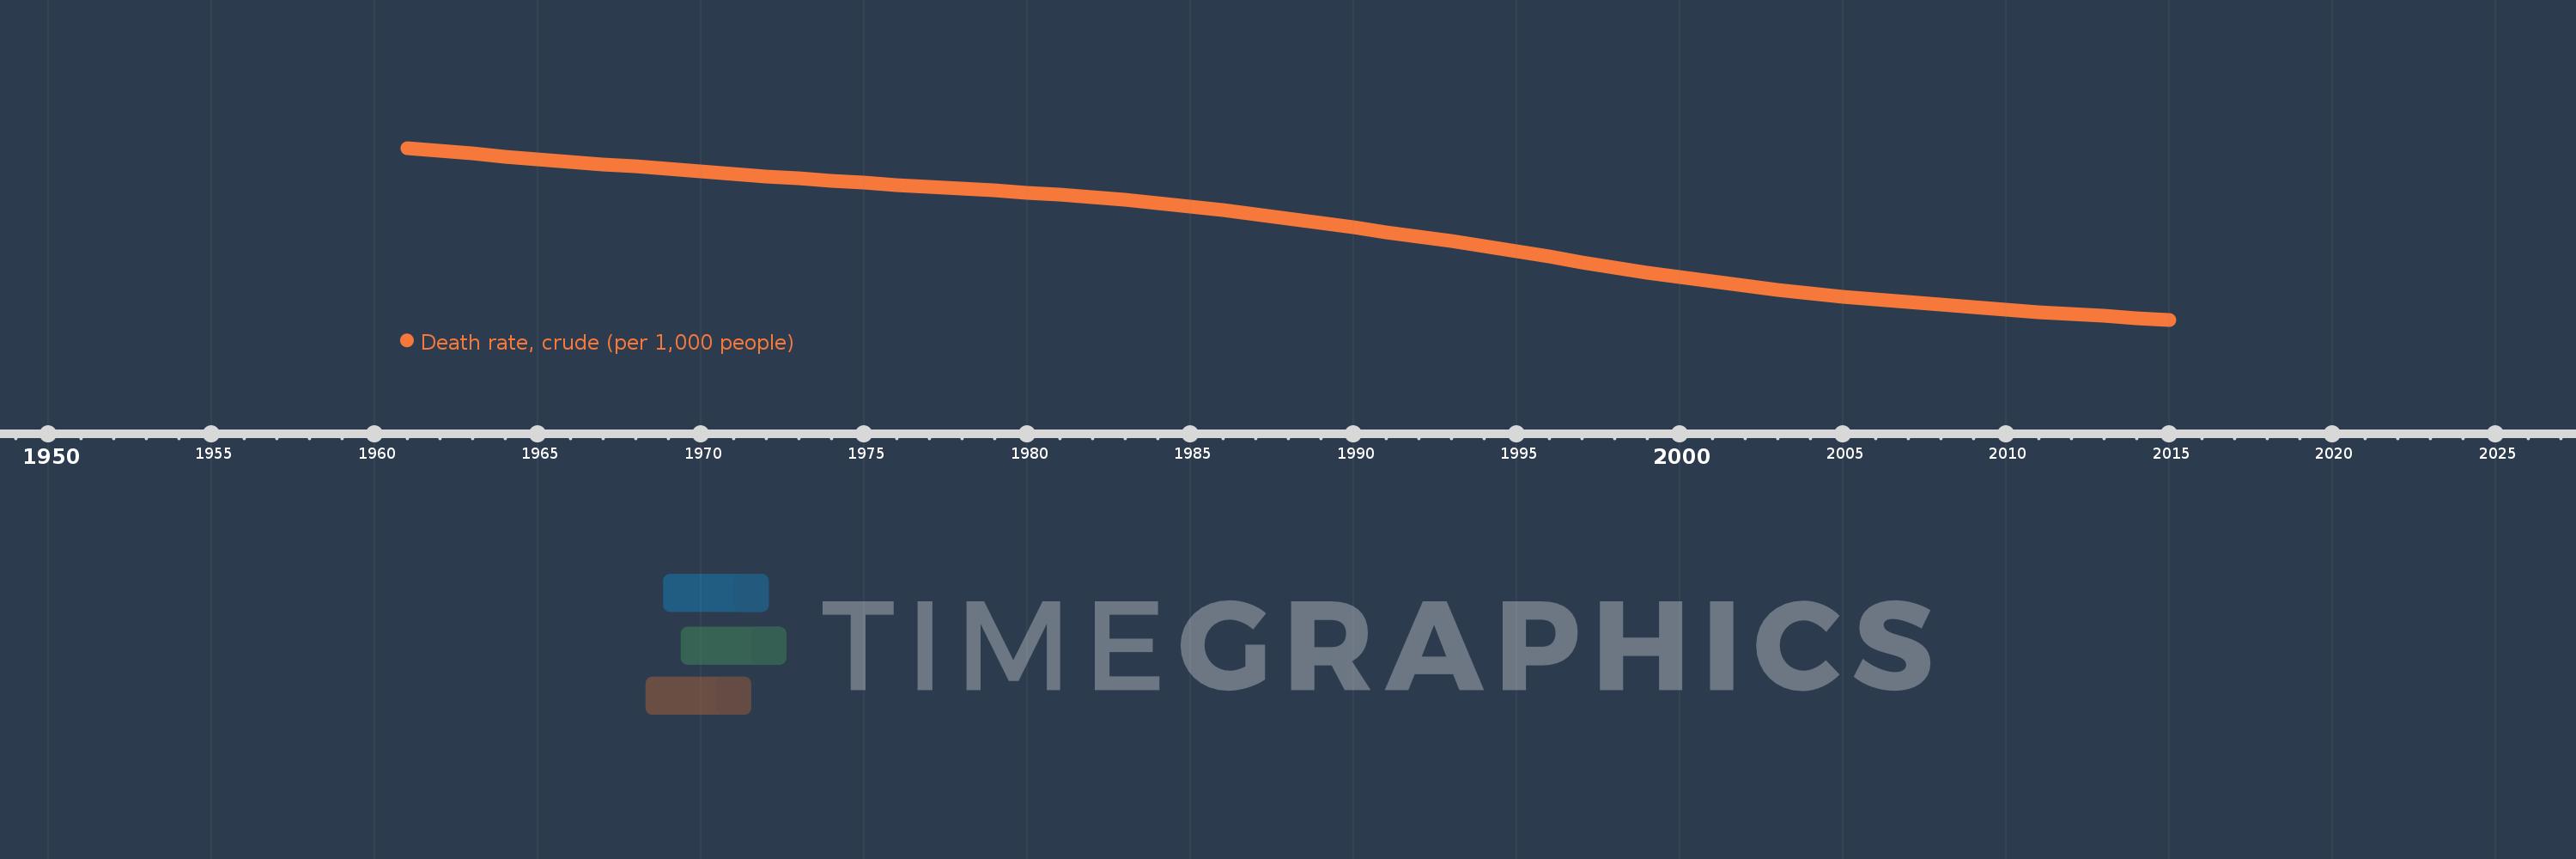
Death rate, crude (per 1,000 people)
2015,2014,2013,2012,2011,2010,2009,2008,2007,2006,2005,2004,2003,2002,2001,2000,1999,1998,1997,1996,1995,1994,1993,1992,1991,1990,1989,1988,1987,1986,1985,1984,1983,1982,1981,1980,1979,1978,1977,1976,1975,1974,1973,1972,1971,1970,1969,1968,1967,1966,1965,1964,1963,1962,1961
Queste statistiche in altri paesi:
AfghanistanAlbaniaAlgeriaAmerican SamoaAndorraAngolaAntigua and BarbudaArab WorldArgentinaArmeniaArubaAustraliaAustriaAzerbaijanBahamas, TheBahrainBangladeshBarbadosBelarusBelgiumBelizeBeninBermudaBhutanBoliviaBosnia and HerzegovinaBotswanaBrazilBrunei DarussalamBulgariaBurkina FasoBurundiCabo VerdeCambodiaCameroonCanadaCaribbean small statesCayman IslandsCentral African RepublicCentral Europe and the BalticsChadChannel IslandsChileChinaColombiaComorosCongo, Dem. Rep.Congo, Rep.Costa RicaCote d'IvoireCroatiaCubaCuracaoCyprusCzech RepublicDenmarkDjiboutiDominicaDominican RepublicEarly-demographic dividendEast Asia & PacificEast Asia & Pacific (excluding high income)East Asia & Pacific (IDA & IBRD countries)EcuadorEgypt, Arab Rep.El SalvadorEquatorial GuineaEritreaEstoniaEthiopiaEuro areaEurope & Central AsiaEurope & Central Asia (excluding high income)Europe & Central Asia (IDA & IBRD countries)European UnionFaroe IslandsFijiFinlandFragile and conflict affected situationsFranceFrench PolynesiaGabonGambia, TheGeorgiaGermanyGhanaGreeceGreenlandGrenadaGuamGuatemalaGuineaGuinea-BissauGuyanaHaitiHeavily indebted poor countries (HIPC)High incomeHondurasHong Kong SAR, ChinaHungaryIBRD onlyIcelandIDA & IBRD totalIDA blendIDA onlyIDA totalIndiaIndonesiaIran, Islamic Rep.IraqIrelandIsle of ManIsraelItalyJamaicaJapanJordanKazakhstanKenyaKiribatiKorea, Dem. People’s Rep.Korea, Rep.KosovoKuwaitKyrgyz RepublicLao PDRLate-demographic dividendLatin America & Caribbean Latin America & Caribbean (excluding high income)Latin America & the Caribbean (IDA & IBRD countries)LatviaLeast developed countries: UN classificationLebanonLesothoLiberiaLibyaLiechtensteinLithuaniaLow & middle incomeLow incomeLower middle incomeLuxembourgMacao SAR, ChinaMacedonia, FYRMadagascarMalawiMalaysiaMaldivesMaliMaltaMarshall IslandsMauritaniaMauritiusMexicoMicronesia, Fed. Sts.Middle East & North AfricaMiddle East & North Africa (excluding high income)Middle East & North Africa (IDA & IBRD countries)Middle incomeMoldovaMonacoMongoliaMontenegroMoroccoMozambiqueMyanmarNamibiaNepalNetherlandsNew CaledoniaNew ZealandNicaraguaNigerNigeriaNorth AmericaNorwayOECD membersOmanOther small statesPacific island small statesPakistanPalauPanamaPapua New GuineaParaguayPeruPhilippinesPolandPortugalPost-demographic dividendPre-demographic dividendPuerto RicoQatarRomaniaRussian FederationRwandaSamoaSan MarinoSao Tome and PrincipeSaudi ArabiaSenegalSerbiaSeychellesSierra LeoneSingaporeSint Maarten (Dutch part)Slovak RepublicSloveniaSmall statesSolomon IslandsSomaliaSouth AfricaSouth AsiaSouth Asia (IDA & IBRD)South SudanSpainSri LankaSt. Kitts and NevisSt. LuciaSt. Martin (French part)St. Vincent and the GrenadinesSub-Saharan Africa Sub-Saharan Africa (excluding high income)Sub-Saharan Africa (IDA & IBRD countries)SudanSurinameSwazilandSwedenSwitzerlandSyrian Arab RepublicTajikistanTanzaniaThailandTimor-LesteTogoTongaTrinidad and TobagoTunisiaTurkeyTurkmenistanUgandaUkraineUnited Arab EmiratesUnited KingdomUnited StatesUpper middle incomeUruguayUzbekistanVanuatuVenezuela, RBVietnamVirgin Islands (U.S.)West Bank and GazaWorldYemen, Rep.ZambiaZimbabwe Linea del tempo:
Questa scala temporale mostra un grafico dal 1961 anno al 2015 anno. Lao PDR. I dati fino ad 1960 anno non disponibili. Il numero di osservazioni attuali secondo i date: 55.
La fonte (nome):
Indicatori dello sviluppo mondiale
La fonte (organizzazione):
(1) United Nations Population Division. World Population Prospects, (2) Census reports and other statistical publications from national statistical offices, (3) Eurostat: Demographic Statistics, (4) United Nations Statistical Division. Population and Vital Statistics Reprot (various years), (5) U.S. Census Bureau: International Database, and (6) Secretariat of the Pacific Community: Statistics and Demography Programme.
Categorie:
Health
sono stati aggiornati
23 apr 2017 anni
Indicatori delle variazioni dei valori per anni
Minima:
6.768
1 gen 2015 anni
Massimo:
20.313
1 gen 1961 anni
Alla data di osservazione
Valore
Variazione assoluta
La variazione rispetto al valore precedente
1 gen 1961 anni
20.313
+20.313
0.0%
1 gen 1962 anni
20.082
-0.231
-1.14%
1 gen 1963 anni
19.858
-0.224
-1.12%
1 gen 1964 anni
19.643
-0.215
-1.08%
1 gen 1965 anni
19.435
-0.208
-1.06%
1 gen 1966 anni
19.235
-0.2
-1.03%
1 gen 1967 anni
19.039
-0.196
-1.02%
1 gen 1968 anni
18.846
-0.193
-1.01%
1 gen 1969 anni
18.655
-0.191
-1.01%
1 gen 1970 anni
18.464
-0.191
-1.02%
1 gen 1971 anni
18.275
-0.189
-1.02%
1 gen 1972 anni
18.09
-0.185
-1.01%
1 gen 1973 anni
17.911
-0.179
-0.99%
1 gen 1974 anni
17.738
-0.173
-0.97%
1 gen 1975 anni
17.571
-0.167
-0.94%
1 gen 1976 anni
17.41
-0.161
-0.92%
1 gen 1977 anni
17.256
-0.154
-0.88%
1 gen 1978 anni
17.108
-0.148
-0.86%
1 gen 1979 anni
16.959
-0.149
-0.87%
1 gen 1980 anni
16.804
-0.155
-0.91%
1 gen 1981 anni
16.636
-0.168
-1.0%
1 gen 1982 anni
16.444
-0.192
-1.15%
1 gen 1983 anni
16.225
-0.219
-1.33%
1 gen 1984 anni
15.976
-0.249
-1.53%
1 gen 1985 anni
15.696
-0.28
-1.75%
1 gen 1986 anni
15.389
-0.307
-1.96%
1 gen 1987 anni
15.063
-0.326
-2.12%
1 gen 1988 anni
14.726
-0.337
-2.24%
1 gen 1989 anni
14.383
-0.343
-2.33%
1 gen 1990 anni
14.038
-0.345
-2.4%
1 gen 1991 anni
13.688
-0.35
-2.49%
1 gen 1992 anni
13.327
-0.361
-2.64%
1 gen 1993 anni
12.951
-0.376
-2.82%
1 gen 1994 anni
12.557
-0.394
-3.04%
1 gen 1995 anni
12.15
-0.407
-3.24%
1 gen 1996 anni
11.733
-0.417
-3.43%
1 gen 1997 anni
11.315
-0.418
-3.56%
1 gen 1998 anni
10.902
-0.413
-3.65%
1 gen 1999 anni
10.503
-0.399
-3.66%
1 gen 2000 anni
10.123
-0.38
-3.62%
1 gen 2001 anni
9.768
-0.355
-3.51%
1 gen 2002 anni
9.441
-0.327
-3.35%
1 gen 2003 anni
9.138
-0.303
-3.21%
1 gen 2004 anni
8.858
-0.28
-3.06%
1 gen 2005 anni
8.6
-0.258
-2.91%
1 gen 2006 anni
8.363
-0.237
-2.76%
1 gen 2007 anni
8.143
-0.22
-2.63%
1 gen 2008 anni
7.939
-0.204
-2.51%
1 gen 2009 anni
7.747
-0.192
-2.42%
1 gen 2010 anni
7.564
-0.183
-2.36%
1 gen 2011 anni
7.39
-0.174
-2.3%
1 gen 2012 anni
7.223
-0.167
-2.26%
1 gen 2013 anni
7.064
-0.159
-2.2%
1 gen 2014 anni
6.912
-0.152
-2.15%
1 gen 2015 anni
6.768
-0.144
-2.08%
Classificazione dei paesi secondo i statistiche attuali per anni


Commenti: