29
/it/
it
AIzaSyAYiBZKx7MnpbEhh9jyipgxe19OcubqV5w
April 1, 2024
96271
Burundi
BDI
true
2
1
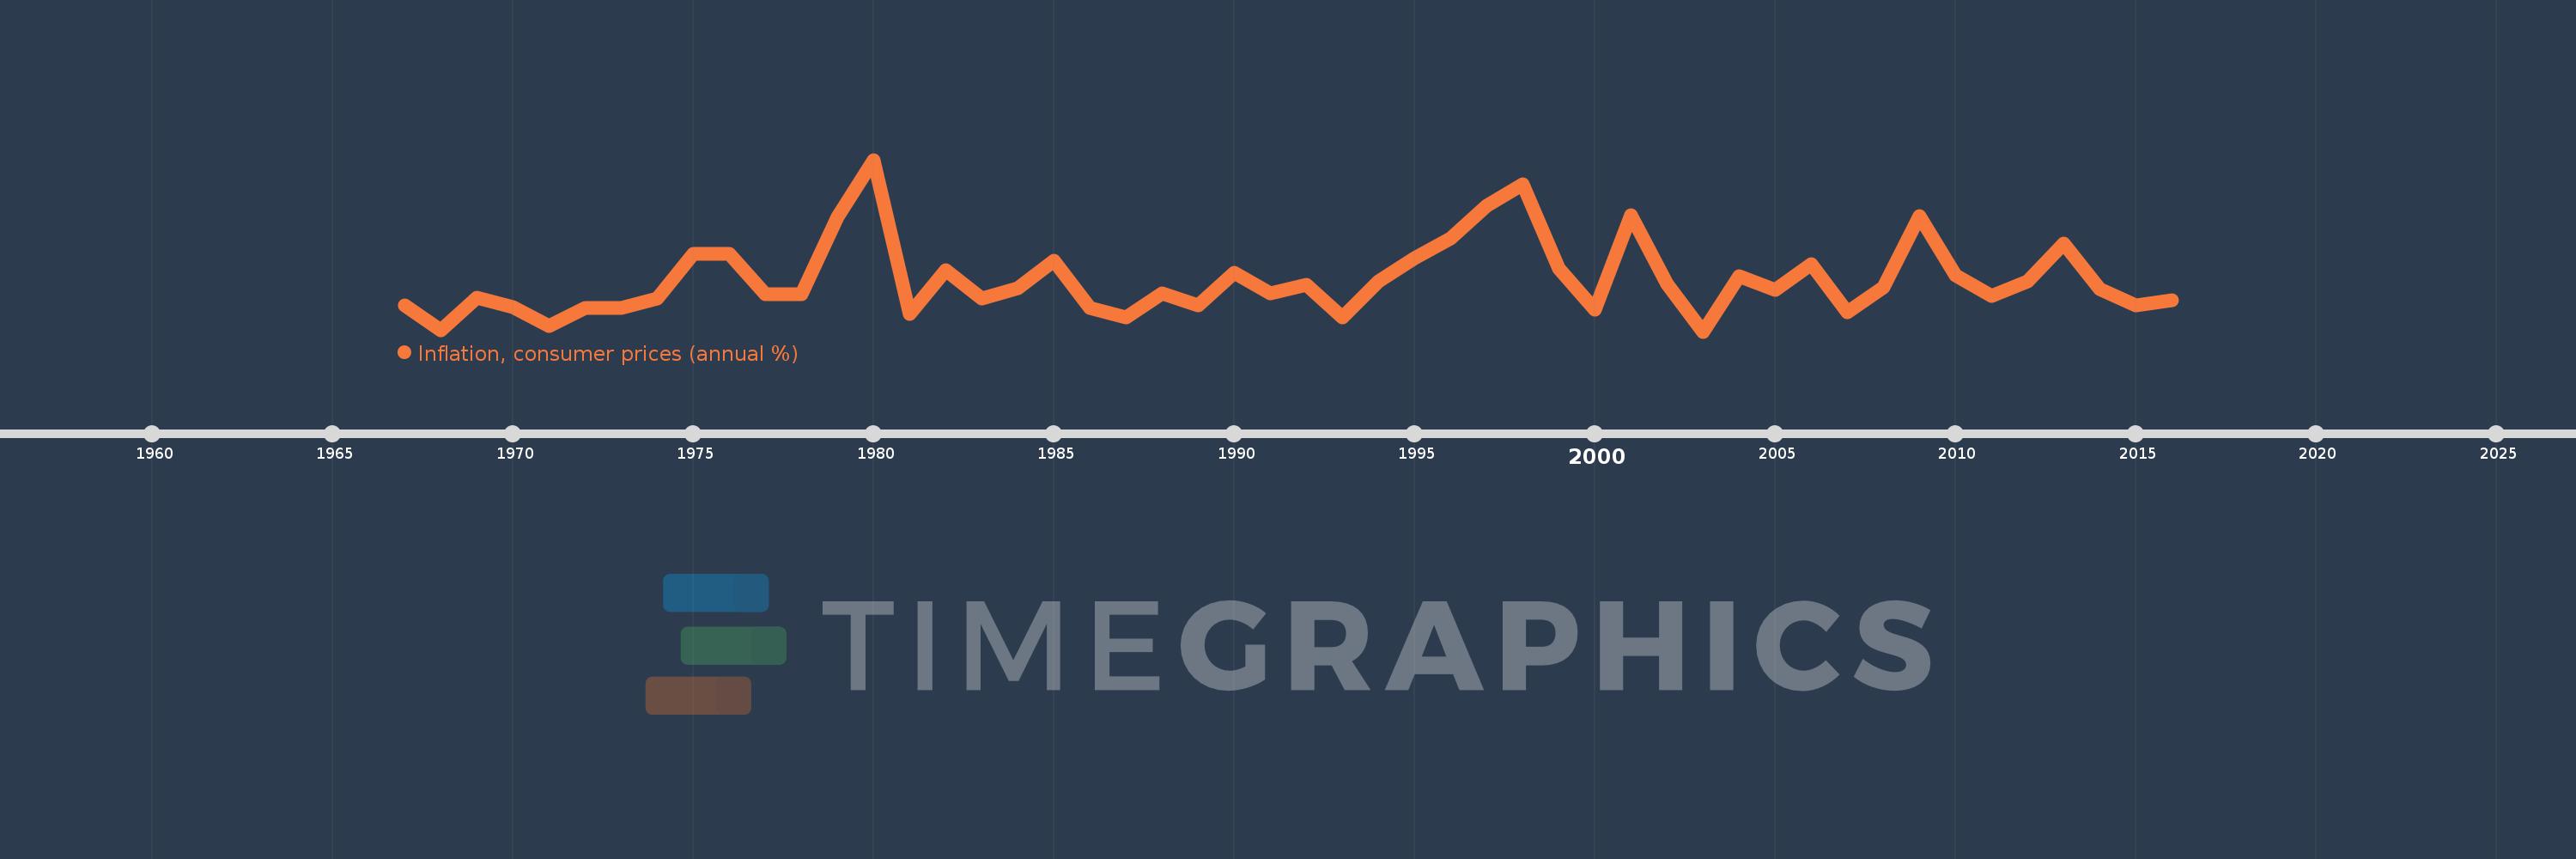
Inflation, consumer prices (annual %)
2016,2015,2014,2013,2012,2011,2010,2009,2008,2007,2006,2005,2004,2003,2002,2001,2000,1999,1998,1997,1996,1995,1994,1993,1992,1991,1990,1989,1988,1987,1986,1985,1984,1983,1982,1981,1980,1979,1978,1977,1976,1975,1974,1973,1972,1971,1970,1969,1968,1967
Queste statistiche in altri paesi:
AfghanistanAlbaniaAlgeriaAngolaAntigua and BarbudaArab WorldArgentinaArmeniaArubaAustraliaAustriaAzerbaijanBahamas, TheBahrainBangladeshBarbadosBelarusBelgiumBelizeBeninBhutanBoliviaBotswanaBrazilBrunei DarussalamBulgariaBurkina FasoBurundiCabo VerdeCambodiaCameroonCanadaCaribbean small statesCentral African RepublicCentral Europe and the BalticsChadChileChinaColombiaComorosCongo, Dem. Rep.Congo, Rep.Costa RicaCote d'IvoireCroatiaCyprusCzech RepublicDenmarkDjiboutiDominicaDominican RepublicEarly-demographic dividendEast Asia & PacificEast Asia & Pacific (excluding high income)East Asia & Pacific (IDA & IBRD countries)EcuadorEgypt, Arab Rep.El SalvadorEquatorial GuineaEstoniaEthiopiaEuro areaEurope & Central AsiaEurope & Central Asia (excluding high income)Europe & Central Asia (IDA & IBRD countries)European UnionFijiFinlandFragile and conflict affected situationsFranceGabonGambia, TheGeorgiaGermanyGhanaGreeceGrenadaGuatemalaGuineaGuinea-BissauGuyanaHaitiHeavily indebted poor countries (HIPC)High incomeHondurasHong Kong SAR, ChinaHungaryIBRD onlyIcelandIDA & IBRD totalIDA blendIDA onlyIDA totalIndiaIndonesiaIran, Islamic Rep.IraqIrelandIsraelItalyJamaicaJapanJordanKazakhstanKenyaKorea, Rep.KuwaitKyrgyz RepublicLao PDRLate-demographic dividendLatin America & Caribbean Latin America & Caribbean (excluding high income)Latin America & the Caribbean (IDA & IBRD countries)LatviaLeast developed countries: UN classificationLebanonLesothoLiberiaLibyaLithuaniaLow & middle incomeLow incomeLower middle incomeLuxembourgMacao SAR, ChinaMacedonia, FYRMadagascarMalawiMalaysiaMaldivesMaliMaltaMauritaniaMauritiusMexicoMiddle East & North AfricaMiddle East & North Africa (excluding high income)Middle East & North Africa (IDA & IBRD countries)Middle incomeMoldovaMongoliaMontenegroMoroccoMozambiqueMyanmarNamibiaNepalNetherlandsNew ZealandNicaraguaNigerNigeriaNorth AmericaNorwayOECD membersOmanOther small statesPakistanPanamaPapua New GuineaParaguayPeruPhilippinesPolandPortugalPost-demographic dividendPre-demographic dividendQatarRomaniaRussian FederationRwandaSamoaSao Tome and PrincipeSaudi ArabiaSenegalSerbiaSeychellesSierra LeoneSingaporeSlovak RepublicSloveniaSmall statesSolomon IslandsSouth AfricaSouth AsiaSouth Asia (IDA & IBRD)South SudanSpainSri LankaSt. Kitts and NevisSt. LuciaSt. Vincent and the GrenadinesSub-Saharan Africa Sub-Saharan Africa (excluding high income)Sub-Saharan Africa (IDA & IBRD countries)SudanSurinameSwazilandSwedenSwitzerlandSyrian Arab RepublicTajikistanTanzaniaThailandTimor-LesteTogoTongaTrinidad and TobagoTunisiaTurkeyUgandaUkraineUnited KingdomUnited StatesUpper middle incomeUruguayVanuatuVenezuela, RBVietnamWorldYemen, Rep.ZambiaZimbabwe Linea del tempo:
Questa scala temporale mostra un grafico dal 1967 anno al 2016 anno. Burundi. I dati fino ad 1966 anno non disponibili. Il numero di osservazioni attuali secondo i date: 50.
La fonte (nome):
Indicatori dello sviluppo mondiale
La fonte (organizzazione):
International Monetary Fund, International Financial Statistics and data files.
Categorie:
Economy & Growth, Financial Sector
sono stati aggiornati
23 apr 2017 anni
Indicatori delle variazioni dei valori per anni
Minima:
-1.371
1 gen 2003 anni
Massimo:
36.541
1 gen 1980 anni
Alla data di osservazione
Valore
Variazione assoluta
La variazione rispetto al valore precedente
1 gen 1967 anni
4.437
+4.437
0.0%
1 gen 1968 anni
-1.089
-5.526
-124.55%
1 gen 1969 anni
6.057
+7.147
-656.06%
1 gen 1970 anni
4.024
-2.033
-33.57%
1 gen 1971 anni
-0.2
-4.224
-104.96%
1 gen 1972 anni
3.851
+4.051
-2.03 Mille.%
1 gen 1973 anni
3.829
-0.022
-0.58%
1 gen 1974 anni
6.006
+2.178
56.89%
1 gen 1975 anni
15.722
+9.716
161.76%
1 gen 1976 anni
15.71
-0.012
-0.08%
1 gen 1977 anni
6.857
-8.853
-56.36%
1 gen 1978 anni
6.835
-0.022
-0.32%
1 gen 1979 anni
23.896
+17.061
249.63%
1 gen 1980 anni
36.541
+12.645
52.92%
1 gen 1981 anni
2.499
-34.042
-93.16%
1 gen 1982 anni
12.167
+9.669
386.98%
1 gen 1983 anni
5.868
-6.299
-51.77%
1 gen 1984 anni
8.151
+2.283
38.91%
1 gen 1985 anni
14.317
+6.166
75.64%
1 gen 1986 anni
3.804
-10.513
-73.43%
1 gen 1987 anni
1.676
-2.129
-55.95%
1 gen 1988 anni
7.113
+5.438
324.5%
1 gen 1989 anni
4.487
-2.626
-36.92%
1 gen 1990 anni
11.662
+7.175
159.91%
1 gen 1991 anni
7.002
-4.659
-39.96%
1 gen 1992 anni
8.997
+1.995
28.49%
1 gen 1993 anni
1.823
-7.174
-79.73%
1 gen 1994 anni
9.679
+7.856
430.86%
1 gen 1995 anni
14.853
+5.173
53.45%
1 gen 1996 anni
19.263
+4.41
29.69%
1 gen 1997 anni
26.437
+7.174
37.24%
1 gen 1998 anni
31.112
+4.675
17.68%
1 gen 1999 anni
12.5
-18.611
-59.82%
1 gen 2000 anni
3.385
-9.115
-72.92%
1 gen 2001 anni
24.318
+20.932
618.31%
1 gen 2002 anni
9.243
-15.075
-61.99%
1 gen 2003 anni
-1.371
-10.614
-114.83%
1 gen 2004 anni
10.762
+12.133
-884.97%
1 gen 2005 anni
7.852
-2.91
-27.04%
1 gen 2006 anni
13.524
+5.672
72.24%
1 gen 2007 anni
2.809
-10.715
-79.23%
1 gen 2008 anni
8.342
+5.533
196.97%
1 gen 2009 anni
24.107
+15.765
188.99%
1 gen 2010 anni
10.981
-13.126
-54.45%
1 gen 2011 anni
6.401
-4.58
-41.71%
1 gen 2012 anni
9.735
+3.334
52.08%
1 gen 2013 anni
18.013
+8.278
85.03%
1 gen 2014 anni
7.951
-10.062
-55.86%
1 gen 2015 anni
4.38
-3.571
-44.91%
1 gen 2016 anni
5.554
+1.174
26.81%
Classificazione dei paesi secondo i statistiche attuali per anni


Commenti: