29
/it/
it
AIzaSyAYiBZKx7MnpbEhh9jyipgxe19OcubqV5w
April 1, 2024
100075
Cameroon
CMR
true
2
1
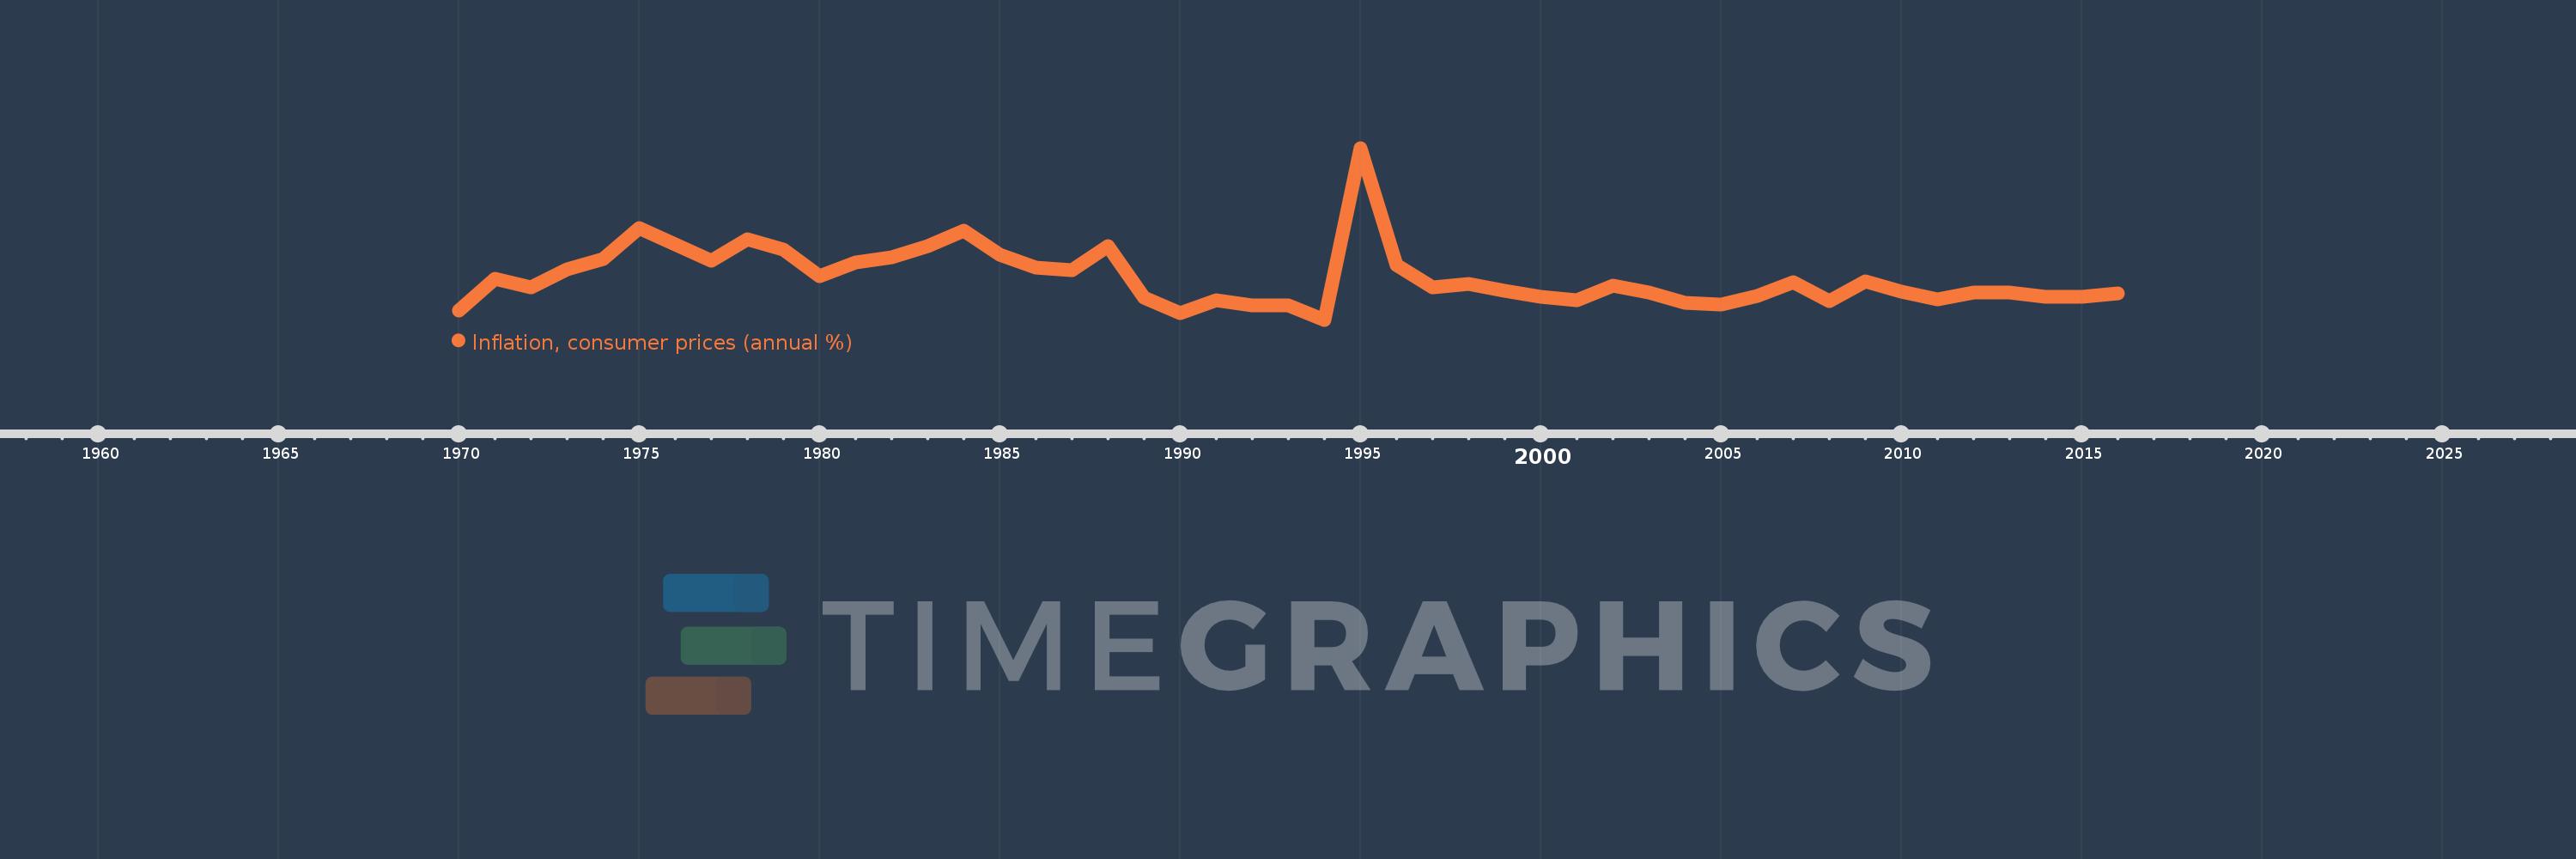
Inflation, consumer prices (annual %)
2016,2015,2014,2013,2012,2011,2010,2009,2008,2007,2006,2005,2004,2003,2002,2001,2000,1999,1998,1997,1996,1995,1994,1993,1992,1991,1990,1989,1988,1987,1986,1985,1984,1983,1982,1981,1980,1979,1978,1977,1976,1975,1974,1973,1972,1971,1970
Queste statistiche in altri paesi:
AfghanistanAlbaniaAlgeriaAngolaAntigua and BarbudaArab WorldArgentinaArmeniaArubaAustraliaAustriaAzerbaijanBahamas, TheBahrainBangladeshBarbadosBelarusBelgiumBelizeBeninBhutanBoliviaBotswanaBrazilBrunei DarussalamBulgariaBurkina FasoBurundiCabo VerdeCambodiaCameroonCanadaCaribbean small statesCentral African RepublicCentral Europe and the BalticsChadChileChinaColombiaComorosCongo, Dem. Rep.Congo, Rep.Costa RicaCote d'IvoireCroatiaCyprusCzech RepublicDenmarkDjiboutiDominicaDominican RepublicEarly-demographic dividendEast Asia & PacificEast Asia & Pacific (excluding high income)East Asia & Pacific (IDA & IBRD countries)EcuadorEgypt, Arab Rep.El SalvadorEquatorial GuineaEstoniaEthiopiaEuro areaEurope & Central AsiaEurope & Central Asia (excluding high income)Europe & Central Asia (IDA & IBRD countries)European UnionFijiFinlandFragile and conflict affected situationsFranceGabonGambia, TheGeorgiaGermanyGhanaGreeceGrenadaGuatemalaGuineaGuinea-BissauGuyanaHaitiHeavily indebted poor countries (HIPC)High incomeHondurasHong Kong SAR, ChinaHungaryIBRD onlyIcelandIDA & IBRD totalIDA blendIDA onlyIDA totalIndiaIndonesiaIran, Islamic Rep.IraqIrelandIsraelItalyJamaicaJapanJordanKazakhstanKenyaKorea, Rep.KuwaitKyrgyz RepublicLao PDRLate-demographic dividendLatin America & Caribbean Latin America & Caribbean (excluding high income)Latin America & the Caribbean (IDA & IBRD countries)LatviaLeast developed countries: UN classificationLebanonLesothoLiberiaLibyaLithuaniaLow & middle incomeLow incomeLower middle incomeLuxembourgMacao SAR, ChinaMacedonia, FYRMadagascarMalawiMalaysiaMaldivesMaliMaltaMauritaniaMauritiusMexicoMiddle East & North AfricaMiddle East & North Africa (excluding high income)Middle East & North Africa (IDA & IBRD countries)Middle incomeMoldovaMongoliaMontenegroMoroccoMozambiqueMyanmarNamibiaNepalNetherlandsNew ZealandNicaraguaNigerNigeriaNorth AmericaNorwayOECD membersOmanOther small statesPakistanPanamaPapua New GuineaParaguayPeruPhilippinesPolandPortugalPost-demographic dividendPre-demographic dividendQatarRomaniaRussian FederationRwandaSamoaSao Tome and PrincipeSaudi ArabiaSenegalSerbiaSeychellesSierra LeoneSingaporeSlovak RepublicSloveniaSmall statesSolomon IslandsSouth AfricaSouth AsiaSouth Asia (IDA & IBRD)South SudanSpainSri LankaSt. Kitts and NevisSt. LuciaSt. Vincent and the GrenadinesSub-Saharan Africa Sub-Saharan Africa (excluding high income)Sub-Saharan Africa (IDA & IBRD countries)SudanSurinameSwazilandSwedenSwitzerlandSyrian Arab RepublicTajikistanTanzaniaThailandTimor-LesteTogoTongaTrinidad and TobagoTunisiaTurkeyUgandaUkraineUnited KingdomUnited StatesUpper middle incomeUruguayVanuatuVenezuela, RBVietnamWorldYemen, Rep.ZambiaZimbabwe Linea del tempo:
Questa scala temporale mostra un grafico dal 1970 anno al 2016 anno. Cameroon. I dati fino ad 1969 anno non disponibili. Il numero di osservazioni attuali secondo i date: 47.
La fonte (nome):
Indicatori dello sviluppo mondiale
La fonte (organizzazione):
International Monetary Fund, International Financial Statistics and data files.
Categorie:
Economy & Growth, Financial Sector
sono stati aggiornati
23 apr 2017 anni
Indicatori delle variazioni dei valori per anni
Minima:
-3.207
1 gen 1994 anni
Massimo:
35.094
1 gen 1995 anni
Alla data di osservazione
Valore
Variazione assoluta
La variazione rispetto al valore precedente
1 gen 1970 anni
-1.102
-1.102
0.0%
1 gen 1971 anni
5.858
+6.96
-631.78%
1 gen 1972 anni
4.014
-1.844
-31.48%
1 gen 1973 anni
8.093
+4.079
101.62%
1 gen 1974 anni
10.385
+2.292
28.32%
1 gen 1975 anni
17.233
+6.848
65.94%
1 gen 1976 anni
13.553
-3.68
-21.35%
1 gen 1977 anni
9.931
-3.623
-26.73%
1 gen 1978 anni
14.698
+4.768
48.01%
1 gen 1979 anni
12.463
-2.235
-15.21%
1 gen 1980 anni
6.581
-5.882
-47.2%
1 gen 1981 anni
9.552
+2.971
45.15%
1 gen 1982 anni
10.727
+1.176
12.31%
1 gen 1983 anni
13.257
+2.53
23.58%
1 gen 1984 anni
16.631
+3.374
25.45%
1 gen 1985 anni
11.373
-5.258
-31.61%
1 gen 1986 anni
8.508
-2.865
-25.19%
1 gen 1987 anni
7.77
-0.738
-8.68%
1 gen 1988 anni
13.14
+5.37
69.12%
1 gen 1989 anni
1.682
-11.458
-87.2%
1 gen 1990 anni
-1.666
-3.348
-199.0%
1 gen 1991 anni
1.099
+2.765
-166.01%
1 gen 1992 anni
0.06
-1.039
-94.54%
1 gen 1993 anni
-0.016
-0.076
-126.74%
1 gen 1994 anni
-3.207
-3.19
19.87 Mille.%
1 gen 1995 anni
35.094
+38.301
-1.19 Mille.%
1 gen 1996 anni
9.07
-26.025
-74.16%
1 gen 1997 anni
3.924
-5.146
-56.73%
1 gen 1998 anni
4.786
+0.862
21.97%
1 gen 1999 anni
3.171
-1.615
-33.75%
1 gen 2000 anni
1.872
-1.299
-40.97%
1 gen 2001 anni
1.227
-0.645
-34.44%
1 gen 2002 anni
4.42
+3.193
260.15%
1 gen 2003 anni
2.834
-1.585
-35.87%
1 gen 2004 anni
0.623
-2.211
-78.01%
1 gen 2005 anni
0.234
-0.39
-62.51%
1 gen 2006 anni
2.014
+1.78
761.79%
1 gen 2007 anni
5.118
+3.104
154.16%
1 gen 2008 anni
0.921
-4.196
-82.0%
1 gen 2009 anni
5.338
+4.416
479.31%
1 gen 2010 anni
3.044
-2.294
-42.98%
1 gen 2011 anni
1.275
-1.768
-58.1%
1 gen 2012 anni
2.94
+1.664
130.5%
1 gen 2013 anni
2.943
+0.003
0.1%
1 gen 2014 anni
1.945
-0.997
-33.9%
1 gen 2015 anni
1.948
+0.003
0.14%
1 gen 2016 anni
2.686
+0.738
37.89%
Classificazione dei paesi secondo i statistiche attuali per anni


Commenti: