29
/it/
it
AIzaSyAYiBZKx7MnpbEhh9jyipgxe19OcubqV5w
April 1, 2024
74054
Austria
AUT
true
2
1
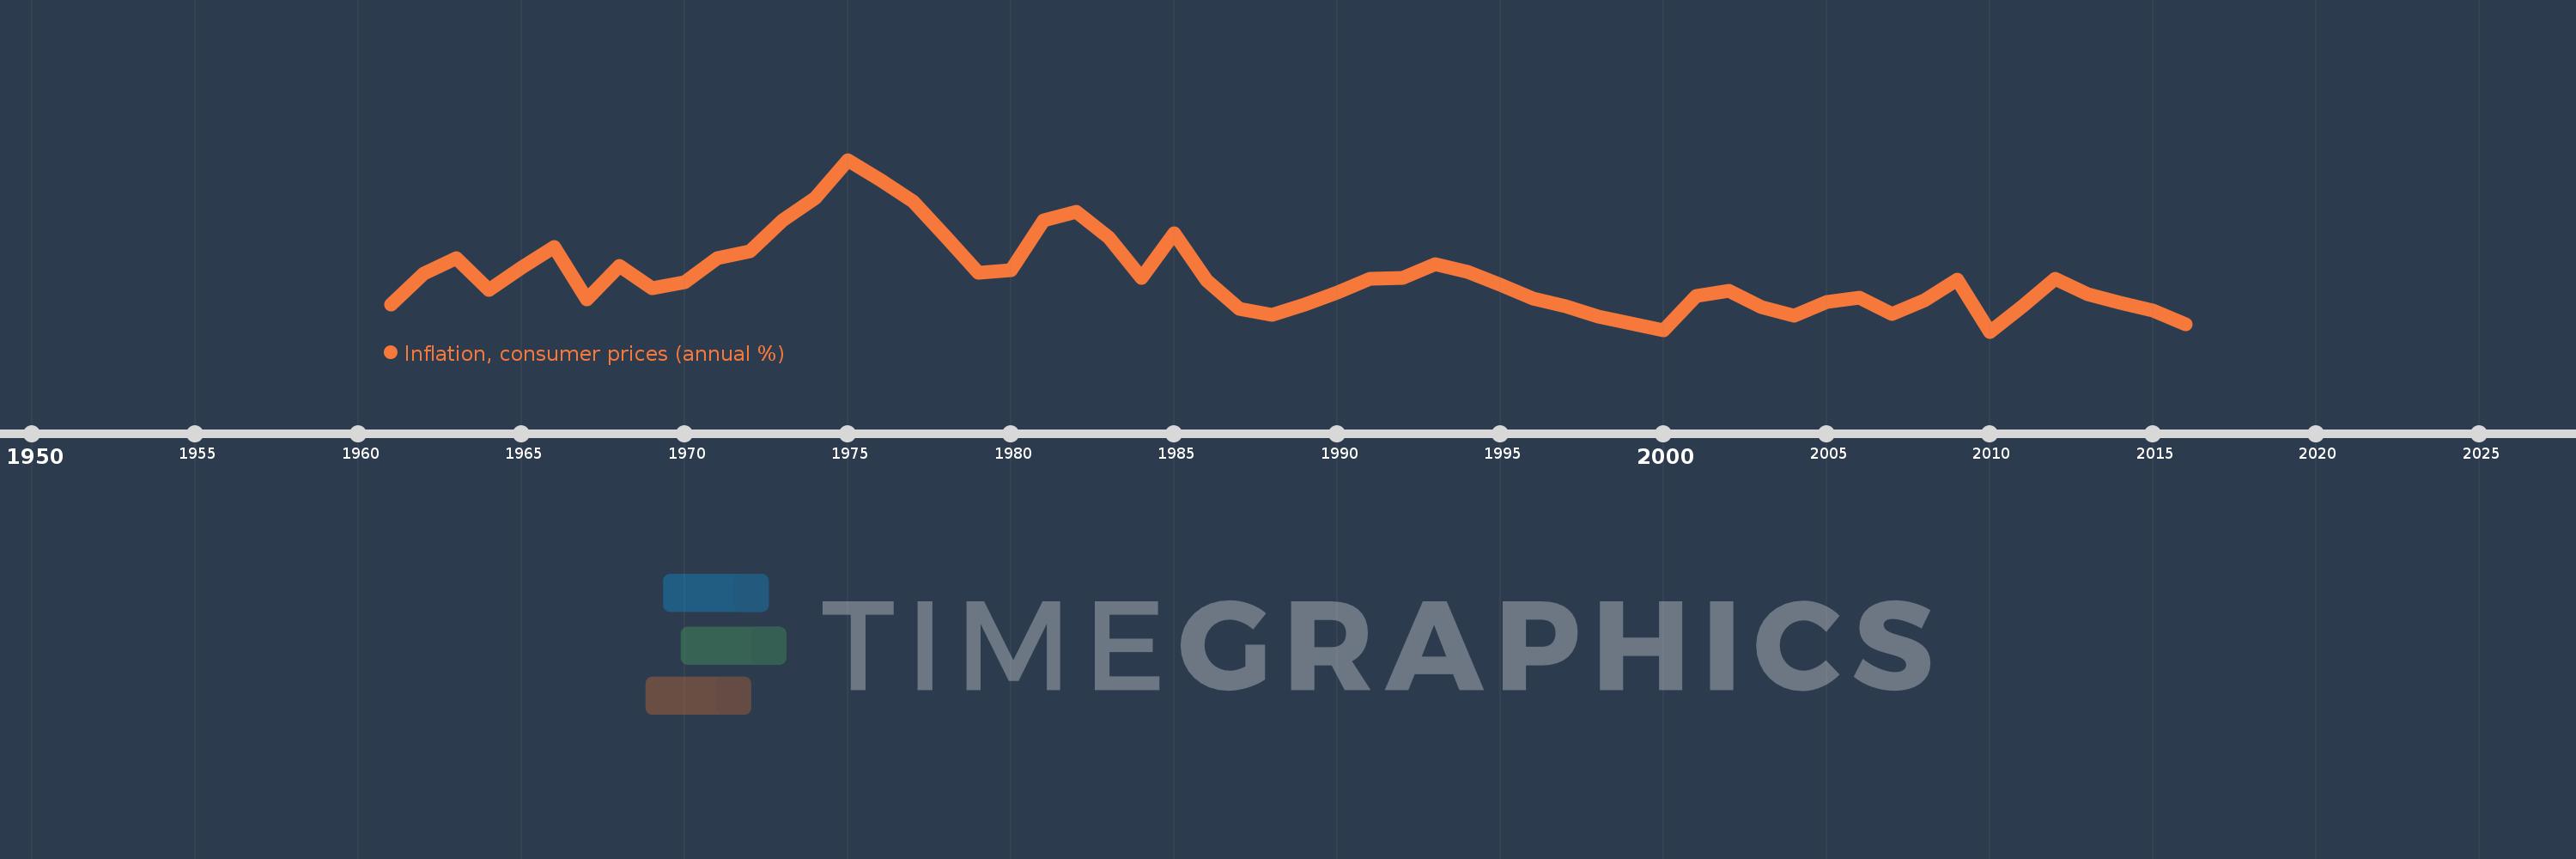
Inflation, consumer prices (annual %)
2016,2015,2014,2013,2012,2011,2010,2009,2008,2007,2006,2005,2004,2003,2002,2001,2000,1999,1998,1997,1996,1995,1994,1993,1992,1991,1990,1989,1988,1987,1986,1985,1984,1983,1982,1981,1980,1979,1978,1977,1976,1975,1974,1973,1972,1971,1970,1969,1968,1967,1966,1965,1964,1963,1962,1961
Queste statistiche in altri paesi:
AfghanistanAlbaniaAlgeriaAngolaAntigua and BarbudaArab WorldArgentinaArmeniaArubaAustraliaAustriaAzerbaijanBahamas, TheBahrainBangladeshBarbadosBelarusBelgiumBelizeBeninBhutanBoliviaBotswanaBrazilBrunei DarussalamBulgariaBurkina FasoBurundiCabo VerdeCambodiaCameroonCanadaCaribbean small statesCentral African RepublicCentral Europe and the BalticsChadChileChinaColombiaComorosCongo, Dem. Rep.Congo, Rep.Costa RicaCote d'IvoireCroatiaCyprusCzech RepublicDenmarkDjiboutiDominicaDominican RepublicEarly-demographic dividendEast Asia & PacificEast Asia & Pacific (excluding high income)East Asia & Pacific (IDA & IBRD countries)EcuadorEgypt, Arab Rep.El SalvadorEquatorial GuineaEstoniaEthiopiaEuro areaEurope & Central AsiaEurope & Central Asia (excluding high income)Europe & Central Asia (IDA & IBRD countries)European UnionFijiFinlandFragile and conflict affected situationsFranceGabonGambia, TheGeorgiaGermanyGhanaGreeceGrenadaGuatemalaGuineaGuinea-BissauGuyanaHaitiHeavily indebted poor countries (HIPC)High incomeHondurasHong Kong SAR, ChinaHungaryIBRD onlyIcelandIDA & IBRD totalIDA blendIDA onlyIDA totalIndiaIndonesiaIran, Islamic Rep.IraqIrelandIsraelItalyJamaicaJapanJordanKazakhstanKenyaKorea, Rep.KuwaitKyrgyz RepublicLao PDRLate-demographic dividendLatin America & Caribbean Latin America & Caribbean (excluding high income)Latin America & the Caribbean (IDA & IBRD countries)LatviaLeast developed countries: UN classificationLebanonLesothoLiberiaLibyaLithuaniaLow & middle incomeLow incomeLower middle incomeLuxembourgMacao SAR, ChinaMacedonia, FYRMadagascarMalawiMalaysiaMaldivesMaliMaltaMauritaniaMauritiusMexicoMiddle East & North AfricaMiddle East & North Africa (excluding high income)Middle East & North Africa (IDA & IBRD countries)Middle incomeMoldovaMongoliaMontenegroMoroccoMozambiqueMyanmarNamibiaNepalNetherlandsNew ZealandNicaraguaNigerNigeriaNorth AmericaNorwayOECD membersOmanOther small statesPakistanPanamaPapua New GuineaParaguayPeruPhilippinesPolandPortugalPost-demographic dividendPre-demographic dividendQatarRomaniaRussian FederationRwandaSamoaSao Tome and PrincipeSaudi ArabiaSenegalSerbiaSeychellesSierra LeoneSingaporeSlovak RepublicSloveniaSmall statesSolomon IslandsSouth AfricaSouth AsiaSouth Asia (IDA & IBRD)South SudanSpainSri LankaSt. Kitts and NevisSt. LuciaSt. Vincent and the GrenadinesSub-Saharan Africa Sub-Saharan Africa (excluding high income)Sub-Saharan Africa (IDA & IBRD countries)SudanSurinameSwazilandSwedenSwitzerlandSyrian Arab RepublicTajikistanTanzaniaThailandTimor-LesteTogoTongaTrinidad and TobagoTunisiaTurkeyUgandaUkraineUnited KingdomUnited StatesUpper middle incomeUruguayVanuatuVenezuela, RBVietnamWorldYemen, Rep.ZambiaZimbabwe Linea del tempo:
Questa scala temporale mostra un grafico dal 1961 anno al 2016 anno. Austria. I dati fino ad 1960 anno non disponibili. Il numero di osservazioni attuali secondo i date: 56.
La fonte (nome):
Indicatori dello sviluppo mondiale
La fonte (organizzazione):
International Monetary Fund, International Financial Statistics and data files.
Categorie:
Economy & Growth, Financial Sector
sono stati aggiornati
23 apr 2017 anni
Indicatori delle variazioni dei valori per anni
Minima:
0.506
1 gen 2010 anni
Massimo:
9.522
1 gen 1975 anni
Alla data di osservazione
Valore
Variazione assoluta
La variazione rispetto al valore precedente
1 gen 1961 anni
1.946
+1.946
0.0%
1 gen 1962 anni
3.542
+1.597
82.05%
1 gen 1963 anni
4.382
+0.84
23.7%
1 gen 1964 anni
2.709
-1.673
-38.18%
1 gen 1965 anni
3.869
+1.16
42.82%
1 gen 1966 anni
4.931
+1.062
27.46%
1 gen 1967 anni
2.206
-2.725
-55.26%
1 gen 1968 anni
3.975
+1.769
80.2%
1 gen 1969 anni
2.773
-1.202
-30.24%
1 gen 1970 anni
3.08
+0.307
11.08%
1 gen 1971 anni
4.373
+1.292
41.96%
1 gen 1972 anni
4.704
+0.331
7.58%
1 gen 1973 anni
6.362
+1.658
35.24%
1 gen 1974 anni
7.524
+1.162
18.26%
1 gen 1975 anni
9.522
+1.998
26.55%
1 gen 1976 anni
8.445
-1.077
-11.31%
1 gen 1977 anni
7.319
-1.127
-13.34%
1 gen 1978 anni
5.475
-1.844
-25.19%
1 gen 1979 anni
3.579
-1.896
-34.63%
1 gen 1980 anni
3.707
+0.128
3.58%
1 gen 1981 anni
6.325
+2.618
70.63%
1 gen 1982 anni
6.807
+0.481
7.61%
1 gen 1983 anni
5.44
-1.366
-20.07%
1 gen 1984 anni
3.335
-2.105
-38.69%
1 gen 1985 anni
5.665
+2.329
69.84%
1 gen 1986 anni
3.19
-2.475
-43.69%
1 gen 1987 anni
1.701
-1.489
-46.67%
1 gen 1988 anni
1.4
-0.301
-17.69%
1 gen 1989 anni
1.931
+0.531
37.95%
1 gen 1990 anni
2.564
+0.633
32.76%
1 gen 1991 anni
3.262
+0.698
27.24%
1 gen 1992 anni
3.334
+0.072
2.21%
1 gen 1993 anni
4.03
+0.695
20.86%
1 gen 1994 anni
3.626
-0.404
-10.02%
1 gen 1995 anni
2.959
-0.667
-18.39%
1 gen 1996 anni
2.25
-0.709
-23.96%
1 gen 1997 anni
1.844
-0.407
-18.07%
1 gen 1998 anni
1.308
-0.535
-29.03%
1 gen 1999 anni
0.921
-0.387
-29.58%
1 gen 2000 anni
0.562
-0.359
-38.95%
1 gen 2001 anni
2.395
+1.833
325.88%
1 gen 2002 anni
2.663
+0.268
11.2%
1 gen 2003 anni
1.802
-0.861
-32.34%
1 gen 2004 anni
1.356
-0.447
-24.78%
1 gen 2005 anni
2.061
+0.706
52.06%
1 gen 2006 anni
2.305
+0.244
11.82%
1 gen 2007 anni
1.45
-0.855
-37.1%
1 gen 2008 anni
2.169
+0.719
49.6%
1 gen 2009 anni
3.216
+1.047
48.29%
1 gen 2010 anni
0.506
-2.71
-84.26%
1 gen 2011 anni
1.814
+1.307
258.18%
1 gen 2012 anni
3.267
+1.453
80.14%
1 gen 2013 anni
2.486
-0.781
-23.91%
1 gen 2014 anni
2.0
-0.486
-19.53%
1 gen 2015 anni
1.606
-0.394
-19.72%
1 gen 2016 anni
0.897
-0.709
-44.17%
Classificazione dei paesi secondo i statistiche attuali per anni


Commenti: