29
/it/
it
AIzaSyAYiBZKx7MnpbEhh9jyipgxe19OcubqV5w
April 1, 2024
101230
Canada
CAN
true
2
1
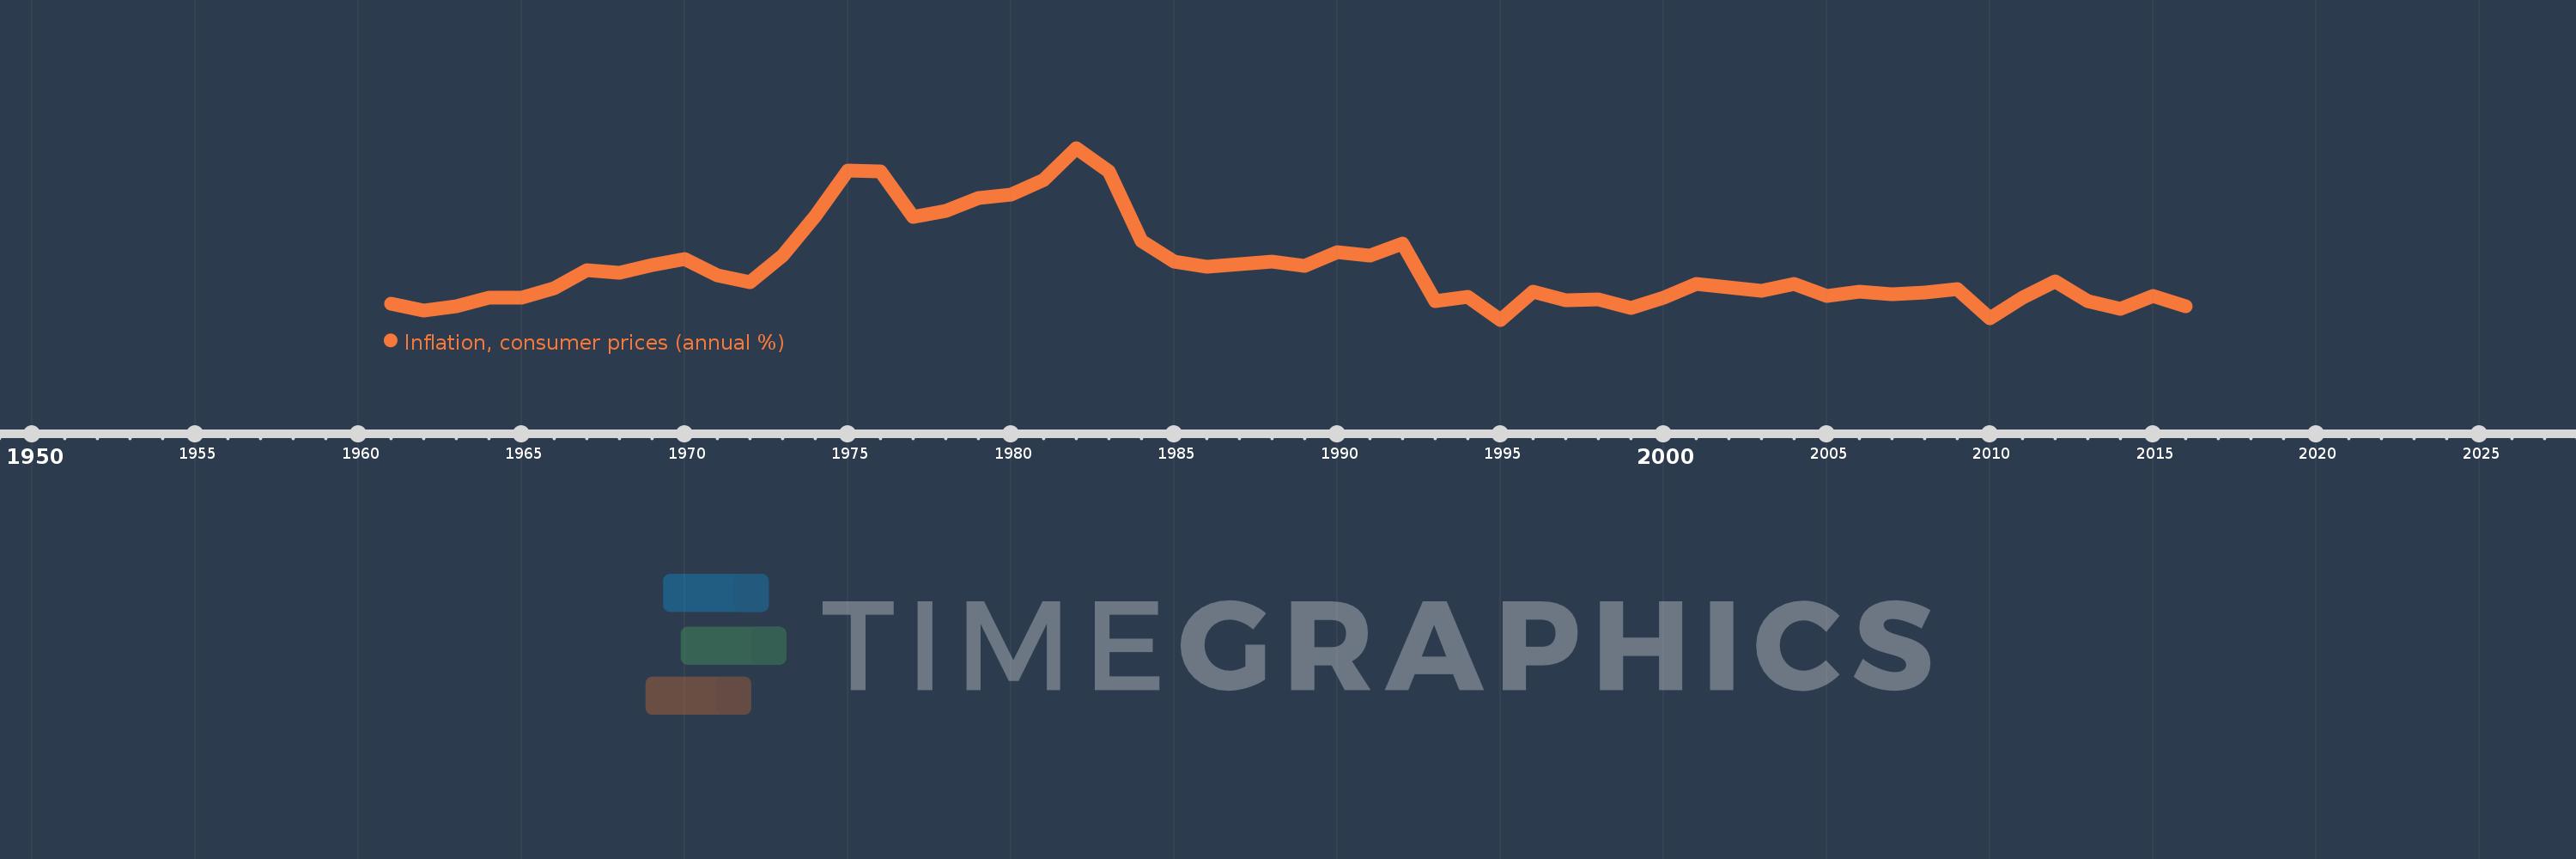
Inflation, consumer prices (annual %)
2016,2015,2014,2013,2012,2011,2010,2009,2008,2007,2006,2005,2004,2003,2002,2001,2000,1999,1998,1997,1996,1995,1994,1993,1992,1991,1990,1989,1988,1987,1986,1985,1984,1983,1982,1981,1980,1979,1978,1977,1976,1975,1974,1973,1972,1971,1970,1969,1968,1967,1966,1965,1964,1963,1962,1961
Queste statistiche in altri paesi:
AfghanistanAlbaniaAlgeriaAngolaAntigua and BarbudaArab WorldArgentinaArmeniaArubaAustraliaAustriaAzerbaijanBahamas, TheBahrainBangladeshBarbadosBelarusBelgiumBelizeBeninBhutanBoliviaBotswanaBrazilBrunei DarussalamBulgariaBurkina FasoBurundiCabo VerdeCambodiaCameroonCanadaCaribbean small statesCentral African RepublicCentral Europe and the BalticsChadChileChinaColombiaComorosCongo, Dem. Rep.Congo, Rep.Costa RicaCote d'IvoireCroatiaCyprusCzech RepublicDenmarkDjiboutiDominicaDominican RepublicEarly-demographic dividendEast Asia & PacificEast Asia & Pacific (excluding high income)East Asia & Pacific (IDA & IBRD countries)EcuadorEgypt, Arab Rep.El SalvadorEquatorial GuineaEstoniaEthiopiaEuro areaEurope & Central AsiaEurope & Central Asia (excluding high income)Europe & Central Asia (IDA & IBRD countries)European UnionFijiFinlandFragile and conflict affected situationsFranceGabonGambia, TheGeorgiaGermanyGhanaGreeceGrenadaGuatemalaGuineaGuinea-BissauGuyanaHaitiHeavily indebted poor countries (HIPC)High incomeHondurasHong Kong SAR, ChinaHungaryIBRD onlyIcelandIDA & IBRD totalIDA blendIDA onlyIDA totalIndiaIndonesiaIran, Islamic Rep.IraqIrelandIsraelItalyJamaicaJapanJordanKazakhstanKenyaKorea, Rep.KuwaitKyrgyz RepublicLao PDRLate-demographic dividendLatin America & Caribbean Latin America & Caribbean (excluding high income)Latin America & the Caribbean (IDA & IBRD countries)LatviaLeast developed countries: UN classificationLebanonLesothoLiberiaLibyaLithuaniaLow & middle incomeLow incomeLower middle incomeLuxembourgMacao SAR, ChinaMacedonia, FYRMadagascarMalawiMalaysiaMaldivesMaliMaltaMauritaniaMauritiusMexicoMiddle East & North AfricaMiddle East & North Africa (excluding high income)Middle East & North Africa (IDA & IBRD countries)Middle incomeMoldovaMongoliaMontenegroMoroccoMozambiqueMyanmarNamibiaNepalNetherlandsNew ZealandNicaraguaNigerNigeriaNorth AmericaNorwayOECD membersOmanOther small statesPakistanPanamaPapua New GuineaParaguayPeruPhilippinesPolandPortugalPost-demographic dividendPre-demographic dividendQatarRomaniaRussian FederationRwandaSamoaSao Tome and PrincipeSaudi ArabiaSenegalSerbiaSeychellesSierra LeoneSingaporeSlovak RepublicSloveniaSmall statesSolomon IslandsSouth AfricaSouth AsiaSouth Asia (IDA & IBRD)South SudanSpainSri LankaSt. Kitts and NevisSt. LuciaSt. Vincent and the GrenadinesSub-Saharan Africa Sub-Saharan Africa (excluding high income)Sub-Saharan Africa (IDA & IBRD countries)SudanSurinameSwazilandSwedenSwitzerlandSyrian Arab RepublicTajikistanTanzaniaThailandTimor-LesteTogoTongaTrinidad and TobagoTunisiaTurkeyUgandaUkraineUnited KingdomUnited StatesUpper middle incomeUruguayVanuatuVenezuela, RBVietnamWorldYemen, Rep.ZambiaZimbabwe Linea del tempo:
Questa scala temporale mostra un grafico dal 1961 anno al 2016 anno. Canada. I dati fino ad 1960 anno non disponibili. Il numero di osservazioni attuali secondo i date: 56.
La fonte (nome):
Indicatori dello sviluppo mondiale
La fonte (organizzazione):
International Monetary Fund, International Financial Statistics and data files.
Categorie:
Economy & Growth, Financial Sector
sono stati aggiornati
23 apr 2017 anni
Indicatori delle variazioni dei valori per anni
Minima:
0.185
1 gen 1995 anni
Massimo:
12.462
1 gen 1982 anni
Alla data di osservazione
Valore
Variazione assoluta
La variazione rispetto al valore precedente
1 gen 1961 anni
1.312
+1.312
0.0%
1 gen 1962 anni
0.866
-0.446
-33.98%
1 gen 1963 anni
1.179
+0.313
36.1%
1 gen 1964 anni
1.769
+0.591
50.12%
1 gen 1965 anni
1.792
+0.023
1.31%
1 gen 1966 anni
2.461
+0.669
37.3%
1 gen 1967 anni
3.737
+1.276
51.87%
1 gen 1968 anni
3.573
-0.165
-4.4%
1 gen 1969 anni
4.086
+0.513
14.35%
1 gen 1970 anni
4.508
+0.423
10.35%
1 gen 1971 anni
3.366
-1.142
-25.34%
1 gen 1972 anni
2.837
-0.53
-15.73%
1 gen 1973 anni
4.775
+1.938
68.34%
1 gen 1974 anni
7.612
+2.837
59.4%
1 gen 1975 anni
10.865
+3.253
42.74%
1 gen 1976 anni
10.813
-0.051
-0.47%
1 gen 1977 anni
7.508
-3.305
-30.57%
1 gen 1978 anni
7.991
+0.483
6.43%
1 gen 1979 anni
8.913
+0.922
11.54%
1 gen 1980 anni
9.145
+0.232
2.6%
1 gen 1981 anni
10.183
+1.039
11.36%
1 gen 1982 anni
12.462
+2.279
22.38%
1 gen 1983 anni
10.803
-1.659
-13.31%
1 gen 1984 anni
5.816
-4.987
-46.16%
1 gen 1985 anni
4.339
-1.477
-25.4%
1 gen 1986 anni
3.951
-0.388
-8.94%
1 gen 1987 anni
4.174
+0.223
5.64%
1 gen 1988 anni
4.365
+0.191
4.57%
1 gen 1989 anni
4.023
-0.342
-7.84%
1 gen 1990 anni
4.995
+0.972
24.17%
1 gen 1991 anni
4.765
-0.23
-4.61%
1 gen 1992 anni
5.615
+0.851
17.85%
1 gen 1993 anni
1.506
-4.109
-73.18%
1 gen 1994 anni
1.841
+0.336
22.28%
1 gen 1995 anni
0.185
-1.656
-89.94%
1 gen 1996 anni
2.168
+1.983
1.07 Mille.%
1 gen 1997 anni
1.571
-0.598
-27.57%
1 gen 1998 anni
1.621
+0.051
3.23%
1 gen 1999 anni
0.996
-0.625
-38.57%
1 gen 2000 anni
1.735
+0.739
74.19%
1 gen 2001 anni
2.719
+0.985
56.75%
1 gen 2002 anni
2.525
-0.194
-7.15%
1 gen 2003 anni
2.258
-0.267
-10.56%
1 gen 2004 anni
2.759
+0.5
22.15%
1 gen 2005 anni
1.857
-0.901
-32.67%
1 gen 2006 anni
2.214
+0.356
19.18%
1 gen 2007 anni
2.002
-0.212
-9.56%
1 gen 2008 anni
2.138
+0.136
6.81%
1 gen 2009 anni
2.37
+0.232
10.84%
1 gen 2010 anni
0.299
-2.071
-87.37%
1 gen 2011 anni
1.777
+1.477
493.35%
1 gen 2012 anni
2.912
+1.135
63.89%
1 gen 2013 anni
1.516
-1.396
-47.95%
1 gen 2014 anni
0.938
-0.577
-38.09%
1 gen 2015 anni
1.907
+0.968
103.2%
1 gen 2016 anni
1.125
-0.781
-40.98%
Classificazione dei paesi secondo i statistiche attuali per anni


Commenti: