29
/it/
it
AIzaSyAYiBZKx7MnpbEhh9jyipgxe19OcubqV5w
April 1, 2024
262400
Thailand
THA
true
2
1
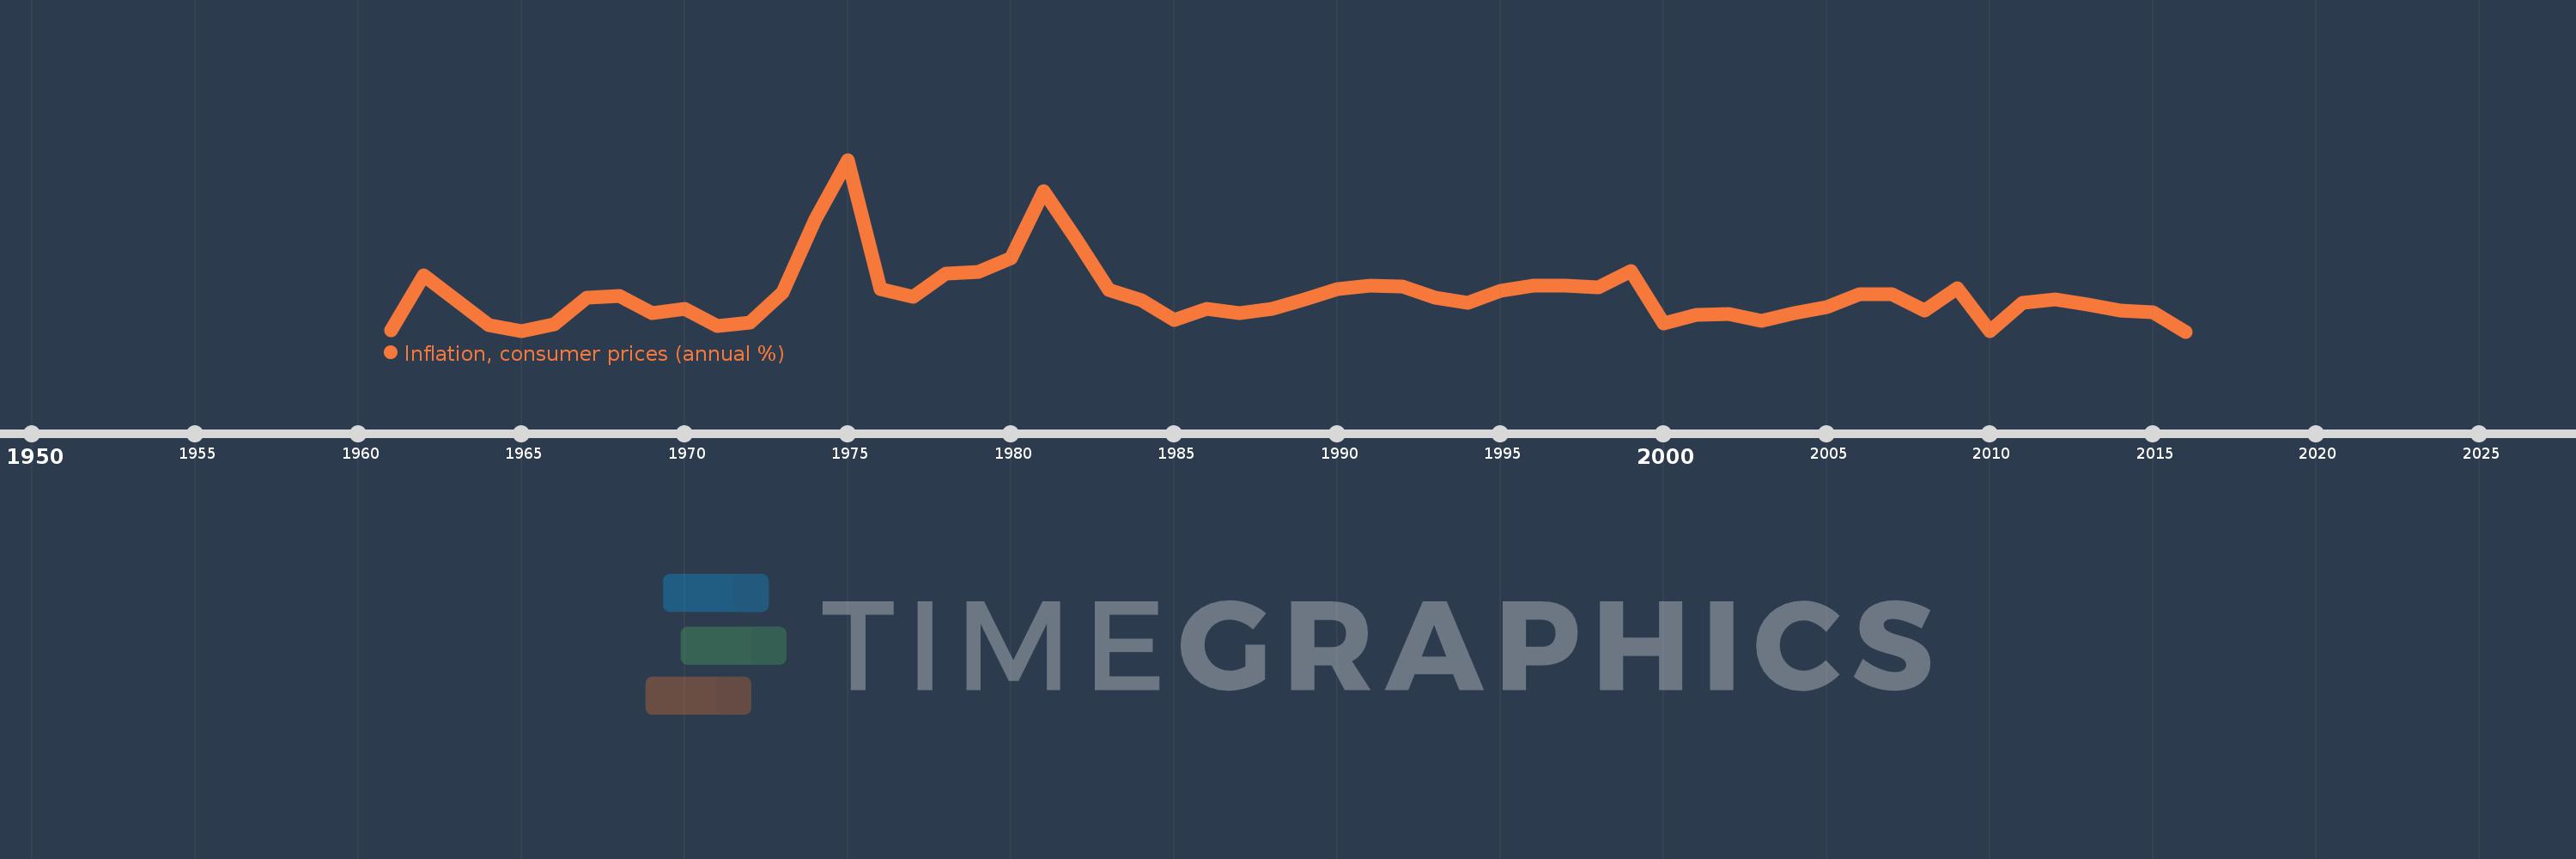
Inflation, consumer prices (annual %)
2016,2015,2014,2013,2012,2011,2010,2009,2008,2007,2006,2005,2004,2003,2002,2001,2000,1999,1998,1997,1996,1995,1994,1993,1992,1991,1990,1989,1988,1987,1986,1985,1984,1983,1982,1981,1980,1979,1978,1977,1976,1975,1974,1973,1972,1971,1970,1969,1968,1967,1966,1965,1964,1963,1962,1961
Queste statistiche in altri paesi:
AfghanistanAlbaniaAlgeriaAngolaAntigua and BarbudaArab WorldArgentinaArmeniaArubaAustraliaAustriaAzerbaijanBahamas, TheBahrainBangladeshBarbadosBelarusBelgiumBelizeBeninBhutanBoliviaBotswanaBrazilBrunei DarussalamBulgariaBurkina FasoBurundiCabo VerdeCambodiaCameroonCanadaCaribbean small statesCentral African RepublicCentral Europe and the BalticsChadChileChinaColombiaComorosCongo, Dem. Rep.Congo, Rep.Costa RicaCote d'IvoireCroatiaCyprusCzech RepublicDenmarkDjiboutiDominicaDominican RepublicEarly-demographic dividendEast Asia & PacificEast Asia & Pacific (excluding high income)East Asia & Pacific (IDA & IBRD countries)EcuadorEgypt, Arab Rep.El SalvadorEquatorial GuineaEstoniaEthiopiaEuro areaEurope & Central AsiaEurope & Central Asia (excluding high income)Europe & Central Asia (IDA & IBRD countries)European UnionFijiFinlandFragile and conflict affected situationsFranceGabonGambia, TheGeorgiaGermanyGhanaGreeceGrenadaGuatemalaGuineaGuinea-BissauGuyanaHaitiHeavily indebted poor countries (HIPC)High incomeHondurasHong Kong SAR, ChinaHungaryIBRD onlyIcelandIDA & IBRD totalIDA blendIDA onlyIDA totalIndiaIndonesiaIran, Islamic Rep.IraqIrelandIsraelItalyJamaicaJapanJordanKazakhstanKenyaKorea, Rep.KuwaitKyrgyz RepublicLao PDRLate-demographic dividendLatin America & Caribbean Latin America & Caribbean (excluding high income)Latin America & the Caribbean (IDA & IBRD countries)LatviaLeast developed countries: UN classificationLebanonLesothoLiberiaLibyaLithuaniaLow & middle incomeLow incomeLower middle incomeLuxembourgMacao SAR, ChinaMacedonia, FYRMadagascarMalawiMalaysiaMaldivesMaliMaltaMauritaniaMauritiusMexicoMiddle East & North AfricaMiddle East & North Africa (excluding high income)Middle East & North Africa (IDA & IBRD countries)Middle incomeMoldovaMongoliaMontenegroMoroccoMozambiqueMyanmarNamibiaNepalNetherlandsNew ZealandNicaraguaNigerNigeriaNorth AmericaNorwayOECD membersOmanOther small statesPakistanPanamaPapua New GuineaParaguayPeruPhilippinesPolandPortugalPost-demographic dividendPre-demographic dividendQatarRomaniaRussian FederationRwandaSamoaSao Tome and PrincipeSaudi ArabiaSenegalSerbiaSeychellesSierra LeoneSingaporeSlovak RepublicSloveniaSmall statesSolomon IslandsSouth AfricaSouth AsiaSouth Asia (IDA & IBRD)South SudanSpainSri LankaSt. Kitts and NevisSt. LuciaSt. Vincent and the GrenadinesSub-Saharan Africa Sub-Saharan Africa (excluding high income)Sub-Saharan Africa (IDA & IBRD countries)SudanSurinameSwazilandSwedenSwitzerlandSyrian Arab RepublicTajikistanTanzaniaThailandTimor-LesteTogoTongaTrinidad and TobagoTunisiaTurkeyUgandaUkraineUnited KingdomUnited StatesUpper middle incomeUruguayVanuatuVenezuela, RBVietnamWorldYemen, Rep.ZambiaZimbabwe Linea del tempo:
Questa scala temporale mostra un grafico dal 1961 anno al 2016 anno. Thailand. I dati fino ad 1960 anno non disponibili. Il numero di osservazioni attuali secondo i date: 56.
La fonte (nome):
Indicatori dello sviluppo mondiale
La fonte (organizzazione):
International Monetary Fund, International Financial Statistics and data files.
Categorie:
Economy & Growth, Financial Sector
sono stati aggiornati
23 apr 2017 anni
Indicatori delle variazioni dei valori per anni
Minima:
-0.895
1 gen 2016 anni
Massimo:
24.314
1 gen 1975 anni
Alla data di osservazione
Valore
Variazione assoluta
La variazione rispetto al valore precedente
1 gen 1961 anni
-0.766
-0.766
0.0%
1 gen 1962 anni
7.387
+8.153
-1.06 Mille.%
1 gen 1963 anni
3.696
-3.691
-49.96%
1 gen 1964 anni
0.0
-3.696
-100.0%
1 gen 1965 anni
-0.792
-0.792
%
1 gen 1966 anni
0.166
+0.958
-121.0%
1 gen 1967 anni
4.035
+3.869
2.33 Mille.%
1 gen 1968 anni
4.31
+0.274
6.8%
1 gen 1969 anni
1.79
-2.519
-58.46%
1 gen 1970 anni
2.45
+0.66
36.87%
1 gen 1971 anni
-0.088
-2.538
-103.59%
1 gen 1972 anni
0.485
+0.573
-650.48%
1 gen 1973 anni
4.838
+4.353
898.19%
1 gen 1974 anni
15.51
+10.672
220.59%
1 gen 1975 anni
24.314
+8.804
56.77%
1 gen 1976 anni
5.33
-18.983
-78.08%
1 gen 1977 anni
4.149
-1.181
-22.15%
1 gen 1978 anni
7.601
+3.452
83.19%
1 gen 1979 anni
7.924
+0.323
4.25%
1 gen 1980 anni
9.897
+1.973
24.9%
1 gen 1981 anni
19.704
+9.806
99.08%
1 gen 1982 anni
12.663
-7.041
-35.73%
1 gen 1983 anni
5.259
-7.404
-58.47%
1 gen 1984 anni
3.727
-1.533
-29.14%
1 gen 1985 anni
0.865
-2.862
-76.79%
1 gen 1986 anni
2.432
+1.567
181.16%
1 gen 1987 anni
1.842
-0.59
-24.26%
1 gen 1988 anni
2.466
+0.625
33.92%
1 gen 1989 anni
3.863
+1.396
56.61%
1 gen 1990 anni
5.355
+1.493
38.64%
1 gen 1991 anni
5.864
+0.509
9.5%
1 gen 1992 anni
5.71
-0.154
-2.63%
1 gen 1993 anni
4.139
-1.571
-27.51%
1 gen 1994 anni
3.312
-0.827
-19.98%
1 gen 1995 anni
5.048
+1.736
52.4%
1 gen 1996 anni
5.818
+0.77
15.26%
1 gen 1997 anni
5.805
-0.013
-0.22%
1 gen 1998 anni
5.626
-0.179
-3.09%
1 gen 1999 anni
7.995
+2.369
42.11%
1 gen 2000 anni
0.285
-7.71
-96.44%
1 gen 2001 anni
1.592
+1.307
459.12%
1 gen 2002 anni
1.627
+0.035
2.19%
1 gen 2003 anni
0.697
-0.93
-57.14%
1 gen 2004 anni
1.804
+1.107
158.76%
1 gen 2005 anni
2.759
+0.955
52.92%
1 gen 2006 anni
4.54
+1.781
64.56%
1 gen 2007 anni
4.637
+0.097
2.14%
1 gen 2008 anni
2.242
-2.396
-51.66%
1 gen 2009 anni
5.468
+3.227
143.96%
1 gen 2010 anni
-0.846
-6.314
-115.47%
1 gen 2011 anni
3.272
+4.118
-486.92%
1 gen 2012 anni
3.81
+0.538
16.43%
1 gen 2013 anni
3.02
-0.79
-20.73%
1 gen 2014 anni
2.184
-0.836
-27.68%
1 gen 2015 anni
1.89
-0.294
-13.45%
1 gen 2016 anni
-0.895
-2.785
-147.35%
Classificazione dei paesi secondo i statistiche attuali per anni


Commenti: