29
/it/
it
AIzaSyAYiBZKx7MnpbEhh9jyipgxe19OcubqV5w
April 1, 2024
93719
Bulgaria
BGR
true
2
1
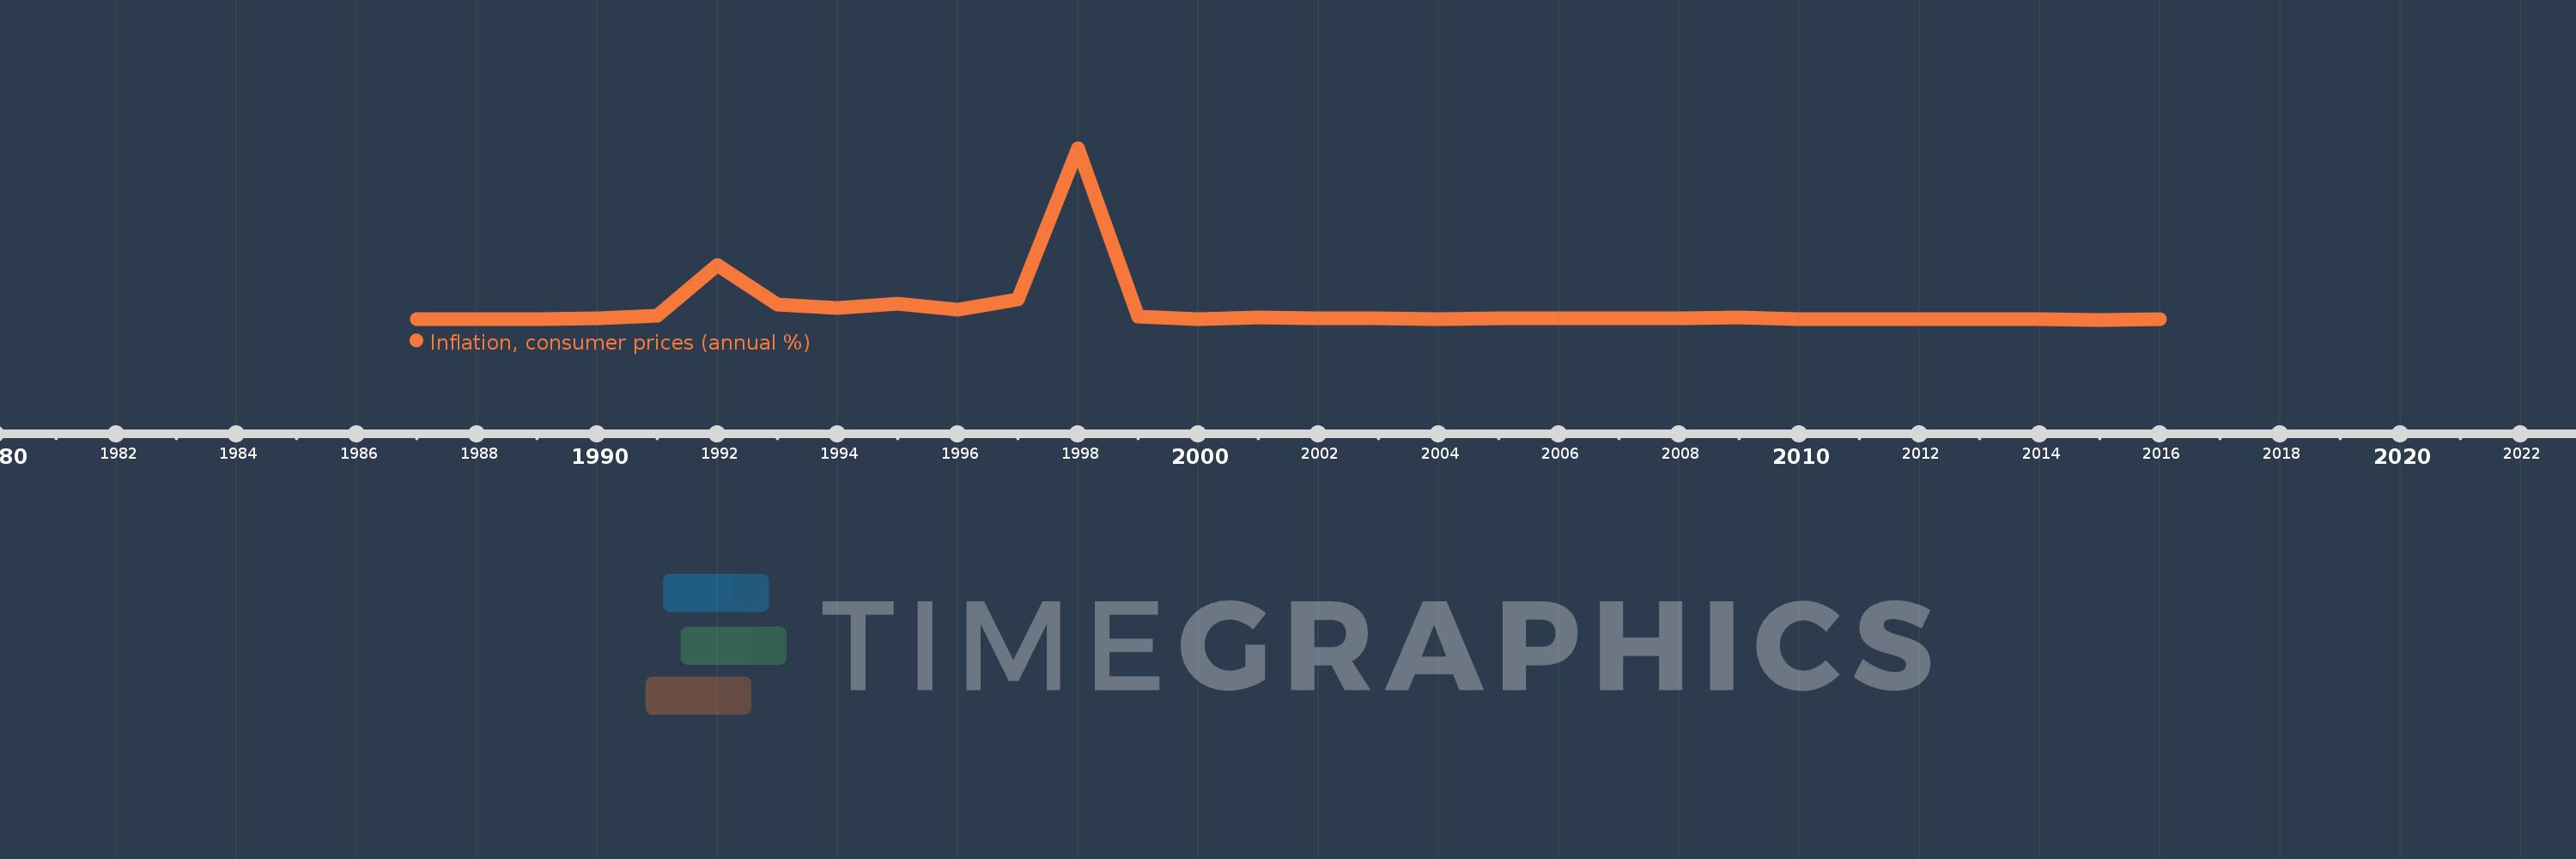
Inflation, consumer prices (annual %)
2016,2015,2014,2013,2012,2011,2010,2009,2008,2007,2006,2005,2004,2003,2002,2001,2000,1999,1998,1997,1996,1995,1994,1993,1992,1991,1990,1989,1988,1987
Queste statistiche in altri paesi:
AfghanistanAlbaniaAlgeriaAngolaAntigua and BarbudaArab WorldArgentinaArmeniaArubaAustraliaAustriaAzerbaijanBahamas, TheBahrainBangladeshBarbadosBelarusBelgiumBelizeBeninBhutanBoliviaBotswanaBrazilBrunei DarussalamBulgariaBurkina FasoBurundiCabo VerdeCambodiaCameroonCanadaCaribbean small statesCentral African RepublicCentral Europe and the BalticsChadChileChinaColombiaComorosCongo, Dem. Rep.Congo, Rep.Costa RicaCote d'IvoireCroatiaCyprusCzech RepublicDenmarkDjiboutiDominicaDominican RepublicEarly-demographic dividendEast Asia & PacificEast Asia & Pacific (excluding high income)East Asia & Pacific (IDA & IBRD countries)EcuadorEgypt, Arab Rep.El SalvadorEquatorial GuineaEstoniaEthiopiaEuro areaEurope & Central AsiaEurope & Central Asia (excluding high income)Europe & Central Asia (IDA & IBRD countries)European UnionFijiFinlandFragile and conflict affected situationsFranceGabonGambia, TheGeorgiaGermanyGhanaGreeceGrenadaGuatemalaGuineaGuinea-BissauGuyanaHaitiHeavily indebted poor countries (HIPC)High incomeHondurasHong Kong SAR, ChinaHungaryIBRD onlyIcelandIDA & IBRD totalIDA blendIDA onlyIDA totalIndiaIndonesiaIran, Islamic Rep.IraqIrelandIsraelItalyJamaicaJapanJordanKazakhstanKenyaKorea, Rep.KuwaitKyrgyz RepublicLao PDRLate-demographic dividendLatin America & Caribbean Latin America & Caribbean (excluding high income)Latin America & the Caribbean (IDA & IBRD countries)LatviaLeast developed countries: UN classificationLebanonLesothoLiberiaLibyaLithuaniaLow & middle incomeLow incomeLower middle incomeLuxembourgMacao SAR, ChinaMacedonia, FYRMadagascarMalawiMalaysiaMaldivesMaliMaltaMauritaniaMauritiusMexicoMiddle East & North AfricaMiddle East & North Africa (excluding high income)Middle East & North Africa (IDA & IBRD countries)Middle incomeMoldovaMongoliaMontenegroMoroccoMozambiqueMyanmarNamibiaNepalNetherlandsNew ZealandNicaraguaNigerNigeriaNorth AmericaNorwayOECD membersOmanOther small statesPakistanPanamaPapua New GuineaParaguayPeruPhilippinesPolandPortugalPost-demographic dividendPre-demographic dividendQatarRomaniaRussian FederationRwandaSamoaSao Tome and PrincipeSaudi ArabiaSenegalSerbiaSeychellesSierra LeoneSingaporeSlovak RepublicSloveniaSmall statesSolomon IslandsSouth AfricaSouth AsiaSouth Asia (IDA & IBRD)South SudanSpainSri LankaSt. Kitts and NevisSt. LuciaSt. Vincent and the GrenadinesSub-Saharan Africa Sub-Saharan Africa (excluding high income)Sub-Saharan Africa (IDA & IBRD countries)SudanSurinameSwazilandSwedenSwitzerlandSyrian Arab RepublicTajikistanTanzaniaThailandTimor-LesteTogoTongaTrinidad and TobagoTunisiaTurkeyUgandaUkraineUnited KingdomUnited StatesUpper middle incomeUruguayVanuatuVenezuela, RBVietnamWorldYemen, Rep.ZambiaZimbabwe Linea del tempo:
Questa scala temporale mostra un grafico dal 1987 anno al 2016 anno. Bulgaria. I dati fino ad 1986 anno non disponibili. Il numero di osservazioni attuali secondo i date: 30.
La fonte (nome):
Indicatori dello sviluppo mondiale
La fonte (organizzazione):
International Monetary Fund, International Financial Statistics and data files.
Categorie:
Economy & Growth, Financial Sector
sono stati aggiornati
23 apr 2017 anni
Indicatori delle variazioni dei valori per anni
Minima:
-1.418
1 gen 2015 anni
Massimo:
1.058 Mille.
1 gen 1998 anni
Alla data di osservazione
Valore
Variazione assoluta
La variazione rispetto al valore precedente
1 gen 1987 anni
2.7
+2.7
0.0%
1 gen 1988 anni
2.726
+0.026
0.98%
1 gen 1989 anni
2.37
-0.357
-13.08%
1 gen 1990 anni
6.389
+4.019
169.61%
1 gen 1991 anni
23.8
+17.411
272.52%
1 gen 1992 anni
338.449
+314.649
1.32 Mille.%
1 gen 1993 anni
91.298
-247.151
-73.02%
1 gen 1994 anni
72.879
-18.419
-20.17%
1 gen 1995 anni
96.057
+23.179
31.8%
1 gen 1996 anni
62.055
-34.003
-35.4%
1 gen 1997 anni
121.608
+59.553
95.97%
1 gen 1998 anni
1.058 Mille.
+936.766
770.32%
1 gen 1999 anni
18.672
-1.04 Mille.
-98.24%
1 gen 2000 anni
2.573
-16.099
-86.22%
1 gen 2001 anni
10.316
+7.743
300.94%
1 gen 2002 anni
7.361
-2.955
-28.65%
1 gen 2003 anni
5.81
-1.551
-21.07%
1 gen 2004 anni
2.157
-3.653
-62.87%
1 gen 2005 anni
6.346
+4.189
194.2%
1 gen 2006 anni
5.039
-1.307
-20.6%
1 gen 2007 anni
7.262
+2.223
44.11%
1 gen 2008 anni
8.402
+1.141
15.71%
1 gen 2009 anni
12.349
+3.946
46.97%
1 gen 2010 anni
2.753
-9.596
-77.7%
1 gen 2011 anni
2.439
-0.314
-11.41%
1 gen 2012 anni
4.22
+1.781
73.02%
1 gen 2013 anni
2.955
-1.265
-29.98%
1 gen 2014 anni
0.89
-2.064
-69.87%
1 gen 2015 anni
-1.418
-2.308
-259.32%
1 gen 2016 anni
-0.105
+1.313
-92.6%
Classificazione dei paesi secondo i statistiche attuali per anni


Commenti: