29
/it/
it
AIzaSyAYiBZKx7MnpbEhh9jyipgxe19OcubqV5w
April 1, 2024
257449
Switzerland
CHE
true
2
1
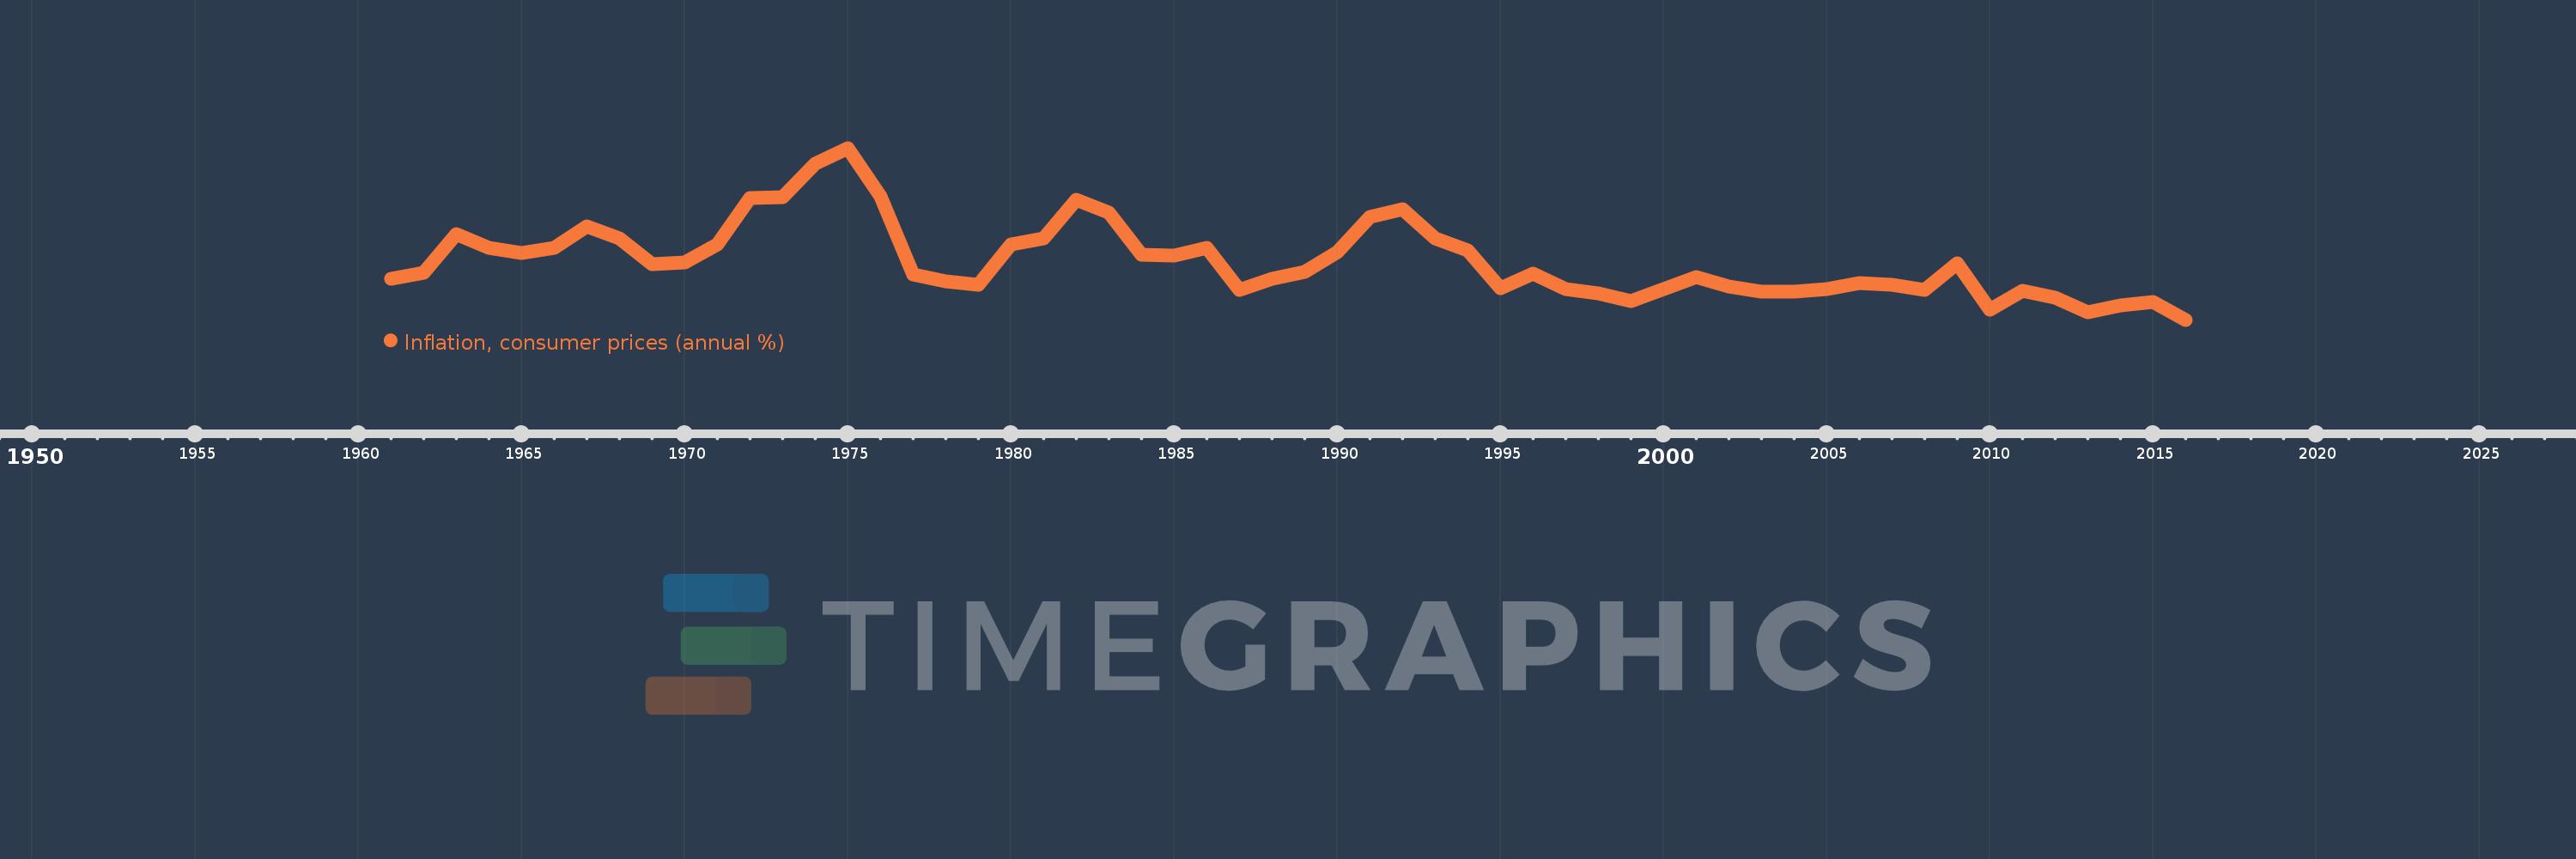
Inflation, consumer prices (annual %)
2016,2015,2014,2013,2012,2011,2010,2009,2008,2007,2006,2005,2004,2003,2002,2001,2000,1999,1998,1997,1996,1995,1994,1993,1992,1991,1990,1989,1988,1987,1986,1985,1984,1983,1982,1981,1980,1979,1978,1977,1976,1975,1974,1973,1972,1971,1970,1969,1968,1967,1966,1965,1964,1963,1962,1961
Queste statistiche in altri paesi:
AfghanistanAlbaniaAlgeriaAngolaAntigua and BarbudaArab WorldArgentinaArmeniaArubaAustraliaAustriaAzerbaijanBahamas, TheBahrainBangladeshBarbadosBelarusBelgiumBelizeBeninBhutanBoliviaBotswanaBrazilBrunei DarussalamBulgariaBurkina FasoBurundiCabo VerdeCambodiaCameroonCanadaCaribbean small statesCentral African RepublicCentral Europe and the BalticsChadChileChinaColombiaComorosCongo, Dem. Rep.Congo, Rep.Costa RicaCote d'IvoireCroatiaCyprusCzech RepublicDenmarkDjiboutiDominicaDominican RepublicEarly-demographic dividendEast Asia & PacificEast Asia & Pacific (excluding high income)East Asia & Pacific (IDA & IBRD countries)EcuadorEgypt, Arab Rep.El SalvadorEquatorial GuineaEstoniaEthiopiaEuro areaEurope & Central AsiaEurope & Central Asia (excluding high income)Europe & Central Asia (IDA & IBRD countries)European UnionFijiFinlandFragile and conflict affected situationsFranceGabonGambia, TheGeorgiaGermanyGhanaGreeceGrenadaGuatemalaGuineaGuinea-BissauGuyanaHaitiHeavily indebted poor countries (HIPC)High incomeHondurasHong Kong SAR, ChinaHungaryIBRD onlyIcelandIDA & IBRD totalIDA blendIDA onlyIDA totalIndiaIndonesiaIran, Islamic Rep.IraqIrelandIsraelItalyJamaicaJapanJordanKazakhstanKenyaKorea, Rep.KuwaitKyrgyz RepublicLao PDRLate-demographic dividendLatin America & Caribbean Latin America & Caribbean (excluding high income)Latin America & the Caribbean (IDA & IBRD countries)LatviaLeast developed countries: UN classificationLebanonLesothoLiberiaLibyaLithuaniaLow & middle incomeLow incomeLower middle incomeLuxembourgMacao SAR, ChinaMacedonia, FYRMadagascarMalawiMalaysiaMaldivesMaliMaltaMauritaniaMauritiusMexicoMiddle East & North AfricaMiddle East & North Africa (excluding high income)Middle East & North Africa (IDA & IBRD countries)Middle incomeMoldovaMongoliaMontenegroMoroccoMozambiqueMyanmarNamibiaNepalNetherlandsNew ZealandNicaraguaNigerNigeriaNorth AmericaNorwayOECD membersOmanOther small statesPakistanPanamaPapua New GuineaParaguayPeruPhilippinesPolandPortugalPost-demographic dividendPre-demographic dividendQatarRomaniaRussian FederationRwandaSamoaSao Tome and PrincipeSaudi ArabiaSenegalSerbiaSeychellesSierra LeoneSingaporeSlovak RepublicSloveniaSmall statesSolomon IslandsSouth AfricaSouth AsiaSouth Asia (IDA & IBRD)South SudanSpainSri LankaSt. Kitts and NevisSt. LuciaSt. Vincent and the GrenadinesSub-Saharan Africa Sub-Saharan Africa (excluding high income)Sub-Saharan Africa (IDA & IBRD countries)SudanSurinameSwazilandSwedenSwitzerlandSyrian Arab RepublicTajikistanTanzaniaThailandTimor-LesteTogoTongaTrinidad and TobagoTunisiaTurkeyUgandaUkraineUnited KingdomUnited StatesUpper middle incomeUruguayVanuatuVenezuela, RBVietnamWorldYemen, Rep.ZambiaZimbabwe Linea del tempo:
Questa scala temporale mostra un grafico dal 1961 anno al 2016 anno. Switzerland. I dati fino ad 1960 anno non disponibili. Il numero di osservazioni attuali secondo i date: 56.
La fonte (nome):
Indicatori dello sviluppo mondiale
La fonte (organizzazione):
International Monetary Fund, International Financial Statistics and data files.
Categorie:
Economy & Growth, Financial Sector
sono stati aggiornati
23 apr 2017 anni
Indicatori delle variazioni dei valori per anni
Minima:
-1.144
1 gen 2016 anni
Massimo:
9.767
1 gen 1975 anni
Alla data di osservazione
Valore
Variazione assoluta
La variazione rispetto al valore precedente
1 gen 1961 anni
1.439
+1.439
0.0%
1 gen 1962 anni
1.845
+0.407
28.28%
1 gen 1963 anni
4.316
+2.47
133.86%
1 gen 1964 anni
3.44
-0.876
-20.3%
1 gen 1965 anni
3.081
-0.358
-10.42%
1 gen 1966 anni
3.415
+0.333
10.81%
1 gen 1967 anni
4.776
+1.362
39.88%
1 gen 1968 anni
4.021
-0.755
-15.8%
1 gen 1969 anni
2.412
-1.609
-40.01%
1 gen 1970 anni
2.489
+0.077
3.18%
1 gen 1971 anni
3.616
+1.127
45.28%
1 gen 1972 anni
6.573
+2.957
81.77%
1 gen 1973 anni
6.66
+0.087
1.33%
1 gen 1974 anni
8.755
+2.095
31.45%
1 gen 1975 anni
9.767
+1.012
11.56%
1 gen 1976 anni
6.696
-3.07
-31.44%
1 gen 1977 anni
1.716
-4.981
-74.38%
1 gen 1978 anni
1.285
-0.431
-25.09%
1 gen 1979 anni
1.056
-0.229
-17.85%
1 gen 1980 anni
3.648
+2.592
245.48%
1 gen 1981 anni
4.022
+0.374
10.26%
1 gen 1982 anni
6.49
+2.468
61.37%
1 gen 1983 anni
5.655
-0.835
-12.87%
1 gen 1984 anni
2.968
-2.688
-47.52%
1 gen 1985 anni
2.911
-0.056
-1.9%
1 gen 1986 anni
3.43
+0.519
17.82%
1 gen 1987 anni
0.741
-2.689
-78.4%
1 gen 1988 anni
1.448
+0.707
95.48%
1 gen 1989 anni
1.884
+0.437
30.15%
1 gen 1990 anni
3.163
+1.278
67.84%
1 gen 1991 anni
5.379
+2.216
70.05%
1 gen 1992 anni
5.879
+0.501
9.31%
1 gen 1993 anni
4.041
-1.838
-31.27%
1 gen 1994 anni
3.272
-0.769
-19.04%
1 gen 1995 anni
0.858
-2.413
-73.76%
1 gen 1996 anni
1.799
+0.94
109.54%
1 gen 1997 anni
0.819
-0.98
-54.48%
1 gen 1998 anni
0.522
-0.297
-36.31%
1 gen 1999 anni
0.017
-0.504
-96.74%
1 gen 2000 anni
0.825
+0.808
4.75 Mille.%
1 gen 2001 anni
1.543
+0.719
87.12%
1 gen 2002 anni
0.989
-0.554
-35.92%
1 gen 2003 anni
0.643
-0.346
-35.02%
1 gen 2004 anni
0.638
-0.004
-0.68%
1 gen 2005 anni
0.803
+0.165
25.78%
1 gen 2006 anni
1.172
+0.369
45.97%
1 gen 2007 anni
1.059
-0.113
-9.66%
1 gen 2008 anni
0.733
-0.326
-30.8%
1 gen 2009 anni
2.427
+1.694
231.22%
1 gen 2010 anni
-0.481
-2.907
-119.8%
1 gen 2011 anni
0.699
+1.179
-245.35%
1 gen 2012 anni
0.231
-0.467
-66.88%
1 gen 2013 anni
-0.693
-0.924
-399.35%
1 gen 2014 anni
-0.217
+0.475
-68.62%
1 gen 2015 anni
-0.013
+0.204
-93.93%
1 gen 2016 anni
-1.144
-1.131
8.58 Mille.%
Classificazione dei paesi secondo i statistiche attuali per anni


Commenti: