29
/it/
it
AIzaSyAYiBZKx7MnpbEhh9jyipgxe19OcubqV5w
April 1, 2024
83489
Belize
BLZ
true
2
1
Short-term debt (% of total reserves)
2016,2015,2014,2013,2012,2011,2010,2009,2008,2007,2006,2005,2004,2003,2002,2001,2000,1999,1998,1997,1996,1995,1994,1993,1992,1991,1990,1989,1988,1987,1986,1985,1984,1983,1982,1981,1980,1979,1978
Queste statistiche in altri paesi:
Linea del tempo:
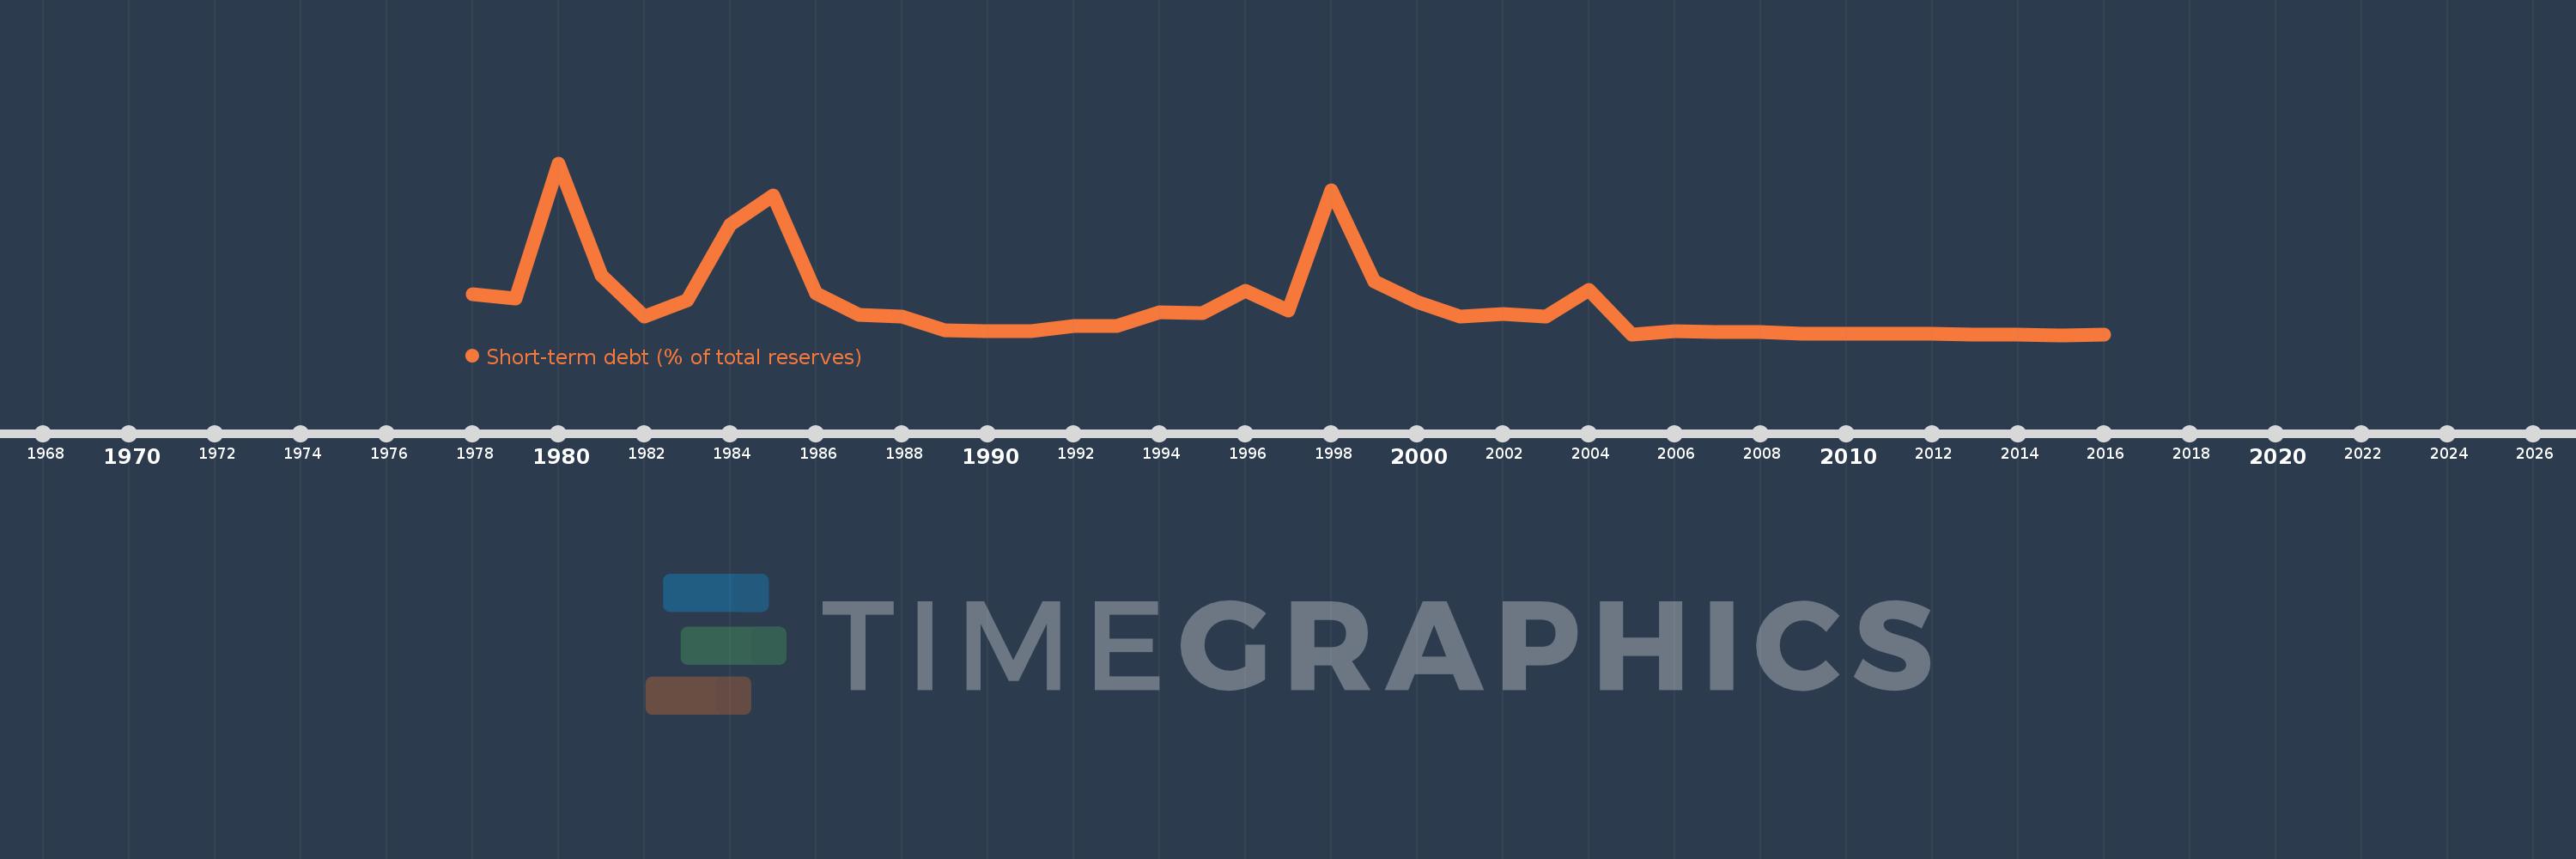
Questa scala temporale mostra un grafico dal 1978 anno al 2016 anno. Belize. I dati fino ad 1977 anno non disponibili. Il numero di osservazioni attuali secondo i date: 39.
La fonte (nome):
Indicatori dello sviluppo mondiale
La fonte (organizzazione):
World Bank, International Debt Statistics.
Categorie:
Economy & Growth, External Debt
sono stati aggiornati
23 apr 2017 anni
Indicatori delle variazioni dei valori per anni
Minima:
1.116
1 gen 2015 anni
Massimo:
363.185
1 gen 1980 anni
Alla data di osservazione
Valore
Variazione assoluta
La variazione rispetto al valore precedente
1 gen 1978 anni
87.276
+87.276
0.0%
1 gen 1979 anni
78.695
-8.581
-9.83%
1 gen 1980 anni
363.185
+284.489
361.51%
1 gen 1981 anni
126.228
-236.957
-65.24%
1 gen 1982 anni
40.331
-85.897
-68.05%
1 gen 1983 anni
75.263
+34.932
86.61%
1 gen 1984 anni
234.184
+158.921
211.15%
1 gen 1985 anni
295.692
+61.508
26.26%
1 gen 1986 anni
89.536
-206.156
-69.72%
1 gen 1987 anni
44.261
-45.275
-50.57%
1 gen 1988 anni
40.549
-3.712
-8.39%
1 gen 1989 anni
10.61
-29.939
-73.83%
1 gen 1990 anni
8.49
-2.12
-19.98%
1 gen 1991 anni
8.734
+0.244
2.88%
1 gen 1992 anni
20.299
+11.565
132.41%
1 gen 1993 anni
20.768
+0.468
2.31%
1 gen 1994 anni
48.869
+28.101
135.31%
1 gen 1995 anni
46.977
-1.892
-3.87%
1 gen 1996 anni
94.979
+48.002
102.18%
1 gen 1997 anni
53.233
-41.746
-43.95%
1 gen 1998 anni
306.341
+253.108
475.47%
1 gen 1999 anni
114.597
-191.744
-62.59%
1 gen 2000 anni
71.523
-43.074
-37.59%
1 gen 2001 anni
40.684
-30.839
-43.12%
1 gen 2002 anni
45.38
+4.696
11.54%
1 gen 2003 anni
40.085
-5.295
-11.67%
1 gen 2004 anni
95.63
+55.545
138.57%
1 gen 2005 anni
2.709
-92.921
-97.17%
1 gen 2006 anni
9.608
+6.899
254.72%
1 gen 2007 anni
6.793
-2.815
-29.3%
1 gen 2008 anni
6.702
-0.09
-1.33%
1 gen 2009 anni
4.504
-2.198
-32.8%
1 gen 2010 anni
4.45
-0.054
-1.2%
1 gen 2011 anni
3.17
-1.28
-28.77%
1 gen 2012 anni
3.297
+0.127
4.02%
1 gen 2013 anni
2.124
-1.173
-35.59%
1 gen 2014 anni
1.419
-0.705
-33.17%
1 gen 2015 anni
1.116
-0.303
-21.35%
1 gen 2016 anni
1.623
+0.507
45.41%
Classificazione dei paesi secondo i statistiche attuali per anni


Commenti: