29
/it/
it
AIzaSyAYiBZKx7MnpbEhh9jyipgxe19OcubqV5w
April 1, 2024
194943
Mauritius
MUS
true
2
1
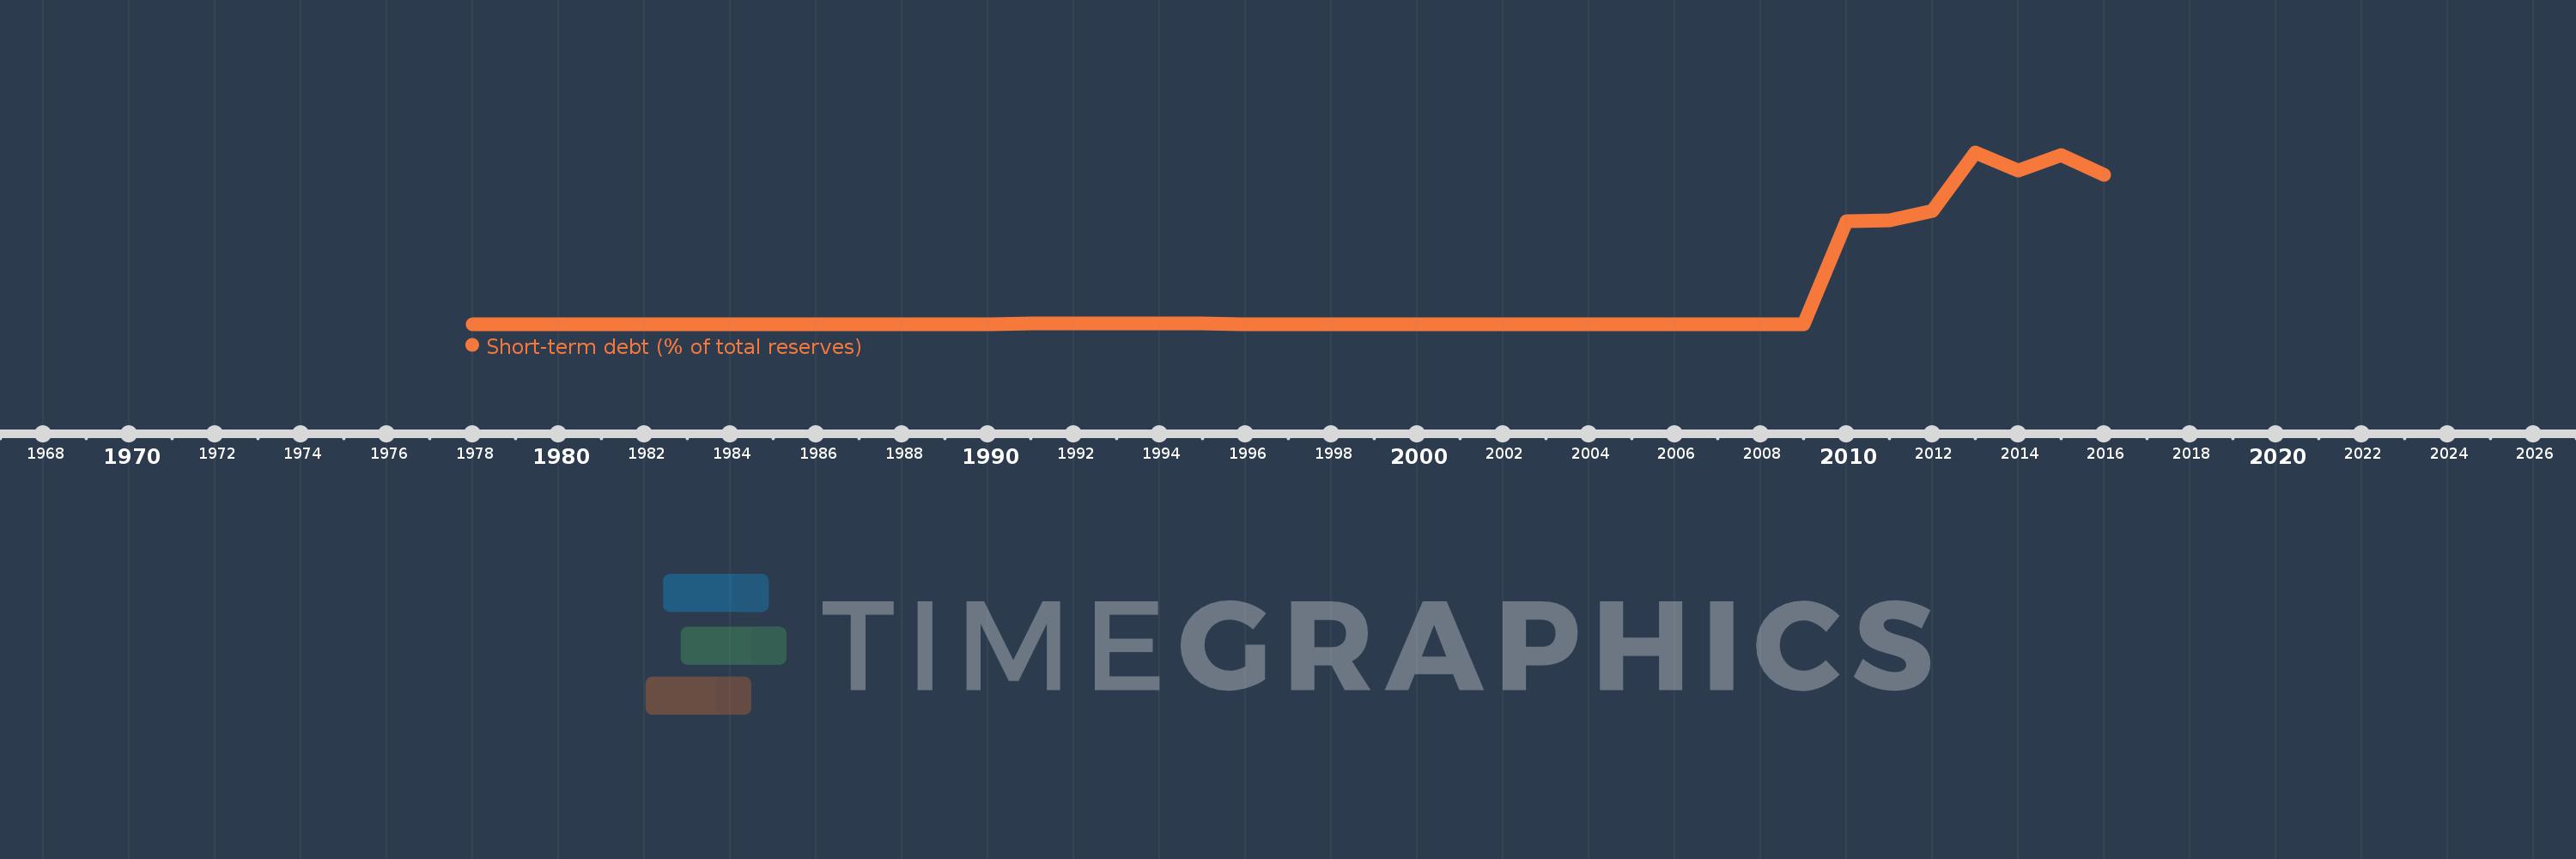
Short-term debt (% of total reserves)
2016,2015,2014,2013,2012,2011,2010,2009,2008,2007,2006,2005,2004,2003,2002,2001,2000,1999,1998,1997,1996,1995,1994,1993,1992,1991,1990,1989,1988,1987,1986,1985,1984,1983,1982,1981,1980,1979,1978
Queste statistiche in altri paesi:
Linea del tempo:
Questa scala temporale mostra un grafico dal 1978 anno al 2016 anno. Mauritius. I dati fino ad 1977 anno non disponibili. Il numero di osservazioni attuali secondo i date: 39.
La fonte (nome):
Indicatori dello sviluppo mondiale
La fonte (organizzazione):
World Bank, International Debt Statistics.
Categorie:
Economy & Growth, External Debt
sono stati aggiornati
23 apr 2017 anni
Indicatori delle variazioni dei valori per anni
Minima:
0.0
1 gen 1979 anni
Massimo:
93.083
1 gen 2013 anni
Alla data di osservazione
Valore
Variazione assoluta
La variazione rispetto al valore precedente
1 gen 1978 anni
0.147
+0.147
0.0%
1 gen 1979 anni
0.0
-0.147
-100.0%
1 gen 1981 anni
0.146
+0.146
%
1 gen 1982 anni
0.09
-0.056
-38.47%
1 gen 1983 anni
0.0
-0.09
-100.0%
1 gen 1985 anni
0.045
+0.045
%
1 gen 1986 anni
0.0
-0.045
-100.0%
1 gen 1989 anni
0.022
+0.022
%
1 gen 1990 anni
0.006
-0.016
-73.47%
1 gen 1991 anni
0.301
+0.296
5.01 Mille.%
1 gen 1992 anni
0.474
+0.173
57.29%
1 gen 1993 anni
0.266
-0.209
-43.98%
1 gen 1994 anni
0.283
+0.018
6.6%
1 gen 1995 anni
0.231
-0.052
-18.36%
1 gen 1996 anni
0.095
-0.137
-59.1%
1 gen 1997 anni
0.006
-0.088
-93.33%
1 gen 1998 anni
0.0
-0.006
-100.0%
1 gen 2010 anni
55.811
+55.811
%
1 gen 2011 anni
56.428
+0.617
1.11%
1 gen 2012 anni
61.521
+5.093
9.03%
1 gen 2013 anni
93.083
+31.562
51.3%
1 gen 2014 anni
83.327
-9.757
-10.48%
1 gen 2015 anni
91.638
+8.312
9.97%
1 gen 2016 anni
80.966
-10.673
-11.65%
Classificazione dei paesi secondo i statistiche attuali per anni


Commenti: