29
/it/
it
AIzaSyAYiBZKx7MnpbEhh9jyipgxe19OcubqV5w
April 1, 2024
111640
Congo, Rep.
COG
true
2
1
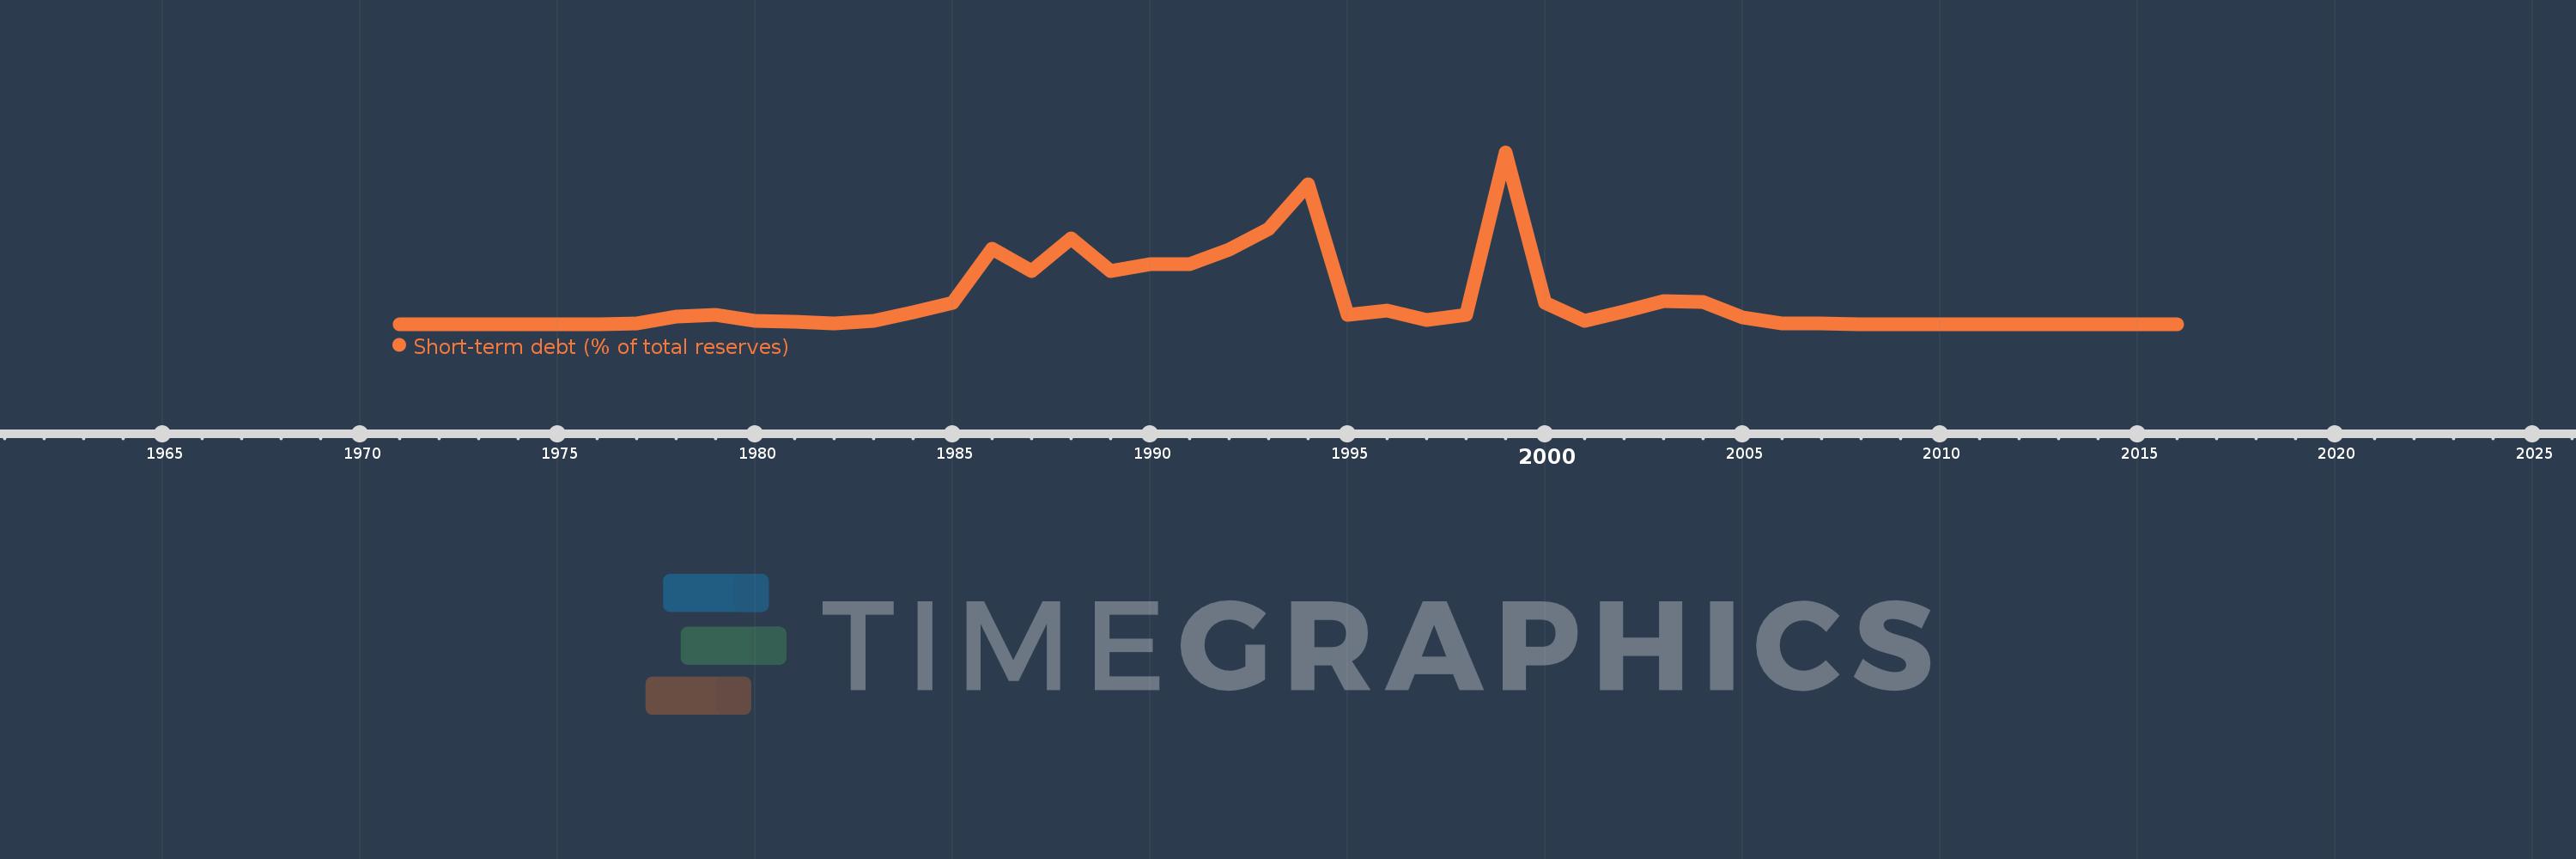
Short-term debt (% of total reserves)
2016,2015,2014,2013,2012,2011,2010,2009,2008,2007,2006,2005,2004,2003,2002,2001,2000,1999,1998,1997,1996,1995,1994,1993,1992,1991,1990,1989,1988,1987,1986,1985,1984,1983,1982,1981,1980,1979,1978,1977,1976,1975,1974,1973,1972,1971
Queste statistiche in altri paesi:
Linea del tempo:
Questa scala temporale mostra un grafico dal 1971 anno al 2016 anno. Congo, Rep.. I dati fino ad 1970 anno non disponibili. Il numero di osservazioni attuali secondo i date: 46.
La fonte (nome):
Indicatori dello sviluppo mondiale
La fonte (organizzazione):
World Bank, International Debt Statistics.
Categorie:
Economy & Growth, External Debt
sono stati aggiornati
23 apr 2017 anni
Indicatori delle variazioni dei valori per anni
Minima:
2.637
1 gen 2012 anni
Massimo:
20.445 Mille.
1 gen 1999 anni
Alla data di osservazione
Valore
Variazione assoluta
La variazione rispetto al valore precedente
1 gen 1971 anni
3.613
+3.613
0.0%
1 gen 1972 anni
6.072
+2.459
68.06%
1 gen 1973 anni
14.374
+8.302
136.73%
1 gen 1974 anni
38.585
+24.21
168.43%
1 gen 1975 anni
15.85
-22.735
-58.92%
1 gen 1976 anni
32.495
+16.645
105.02%
1 gen 1977 anni
57.313
+24.818
76.38%
1 gen 1978 anni
888.223
+830.91
1.45 Mille.%
1 gen 1979 anni
1.073 Mille.
+184.733
20.8%
1 gen 1980 anni
399.238
-673.718
-62.79%
1 gen 1981 anni
266.559
-132.679
-33.23%
1 gen 1982 anni
91.07
-175.489
-65.83%
1 gen 1983 anni
441.187
+350.117
384.45%
1 gen 1984 anni
1.47 Mille.
+1.029 Mille.
233.2%
1 gen 1985 anni
2.577 Mille.
+1.107 Mille.
75.27%
1 gen 1986 anni
8.942 Mille.
+6.365 Mille.
247.05%
1 gen 1987 anni
6.284 Mille.
-2.658 Mille.
-29.72%
1 gen 1988 anni
10.223 Mille.
+3.938 Mille.
62.67%
1 gen 1989 anni
6.32 Mille.
-3.902 Mille.
-38.17%
1 gen 1990 anni
7.177 Mille.
+856.37
13.55%
1 gen 1991 anni
7.18 Mille.
+3.302
0.05%
1 gen 1992 anni
8.919 Mille.
+1.739 Mille.
24.22%
1 gen 1993 anni
11.361 Mille.
+2.442 Mille.
27.38%
1 gen 1994 anni
16.674 Mille.
+5.313 Mille.
46.76%
1 gen 1995 anni
1.102 Mille.
-15.572 Mille.
-93.39%
1 gen 1996 anni
1.588 Mille.
+486.796
44.19%
1 gen 1997 anni
542.199
-1.046 Mille.
-65.87%
1 gen 1998 anni
1.159 Mille.
+616.975
113.79%
1 gen 1999 anni
20.445 Mille.
+19.286 Mille.
1.66 Mille.%
1 gen 2000 anni
2.499 Mille.
-17.946 Mille.
-87.78%
1 gen 2001 anni
388.303
-2.111 Mille.
-84.46%
1 gen 2002 anni
1.558 Mille.
+1.17 Mille.
301.27%
1 gen 2003 anni
2.746 Mille.
+1.188 Mille.
76.23%
1 gen 2004 anni
2.658 Mille.
-88.065
-3.21%
1 gen 2005 anni
763.289
-1.895 Mille.
-71.28%
1 gen 2006 anni
106.796
-656.493
-86.01%
1 gen 2007 anni
44.05
-62.746
-58.75%
1 gen 2008 anni
14.909
-29.141
-66.15%
1 gen 2009 anni
6.881
-8.029
-53.85%
1 gen 2010 anni
6.719
-0.162
-2.35%
1 gen 2011 anni
4.43
-2.289
-34.07%
1 gen 2012 anni
2.637
-1.793
-40.47%
1 gen 2013 anni
3.483
+0.845
32.05%
1 gen 2014 anni
4.374
+0.891
25.58%
1 gen 2015 anni
4.258
-0.115
-2.63%
1 gen 2016 anni
19.403
+15.144
355.64%
Classificazione dei paesi secondo i statistiche attuali per anni


Commenti: