29
/it/
it
AIzaSyAYiBZKx7MnpbEhh9jyipgxe19OcubqV5w
April 1, 2024
151122
Honduras
HND
true
2
1
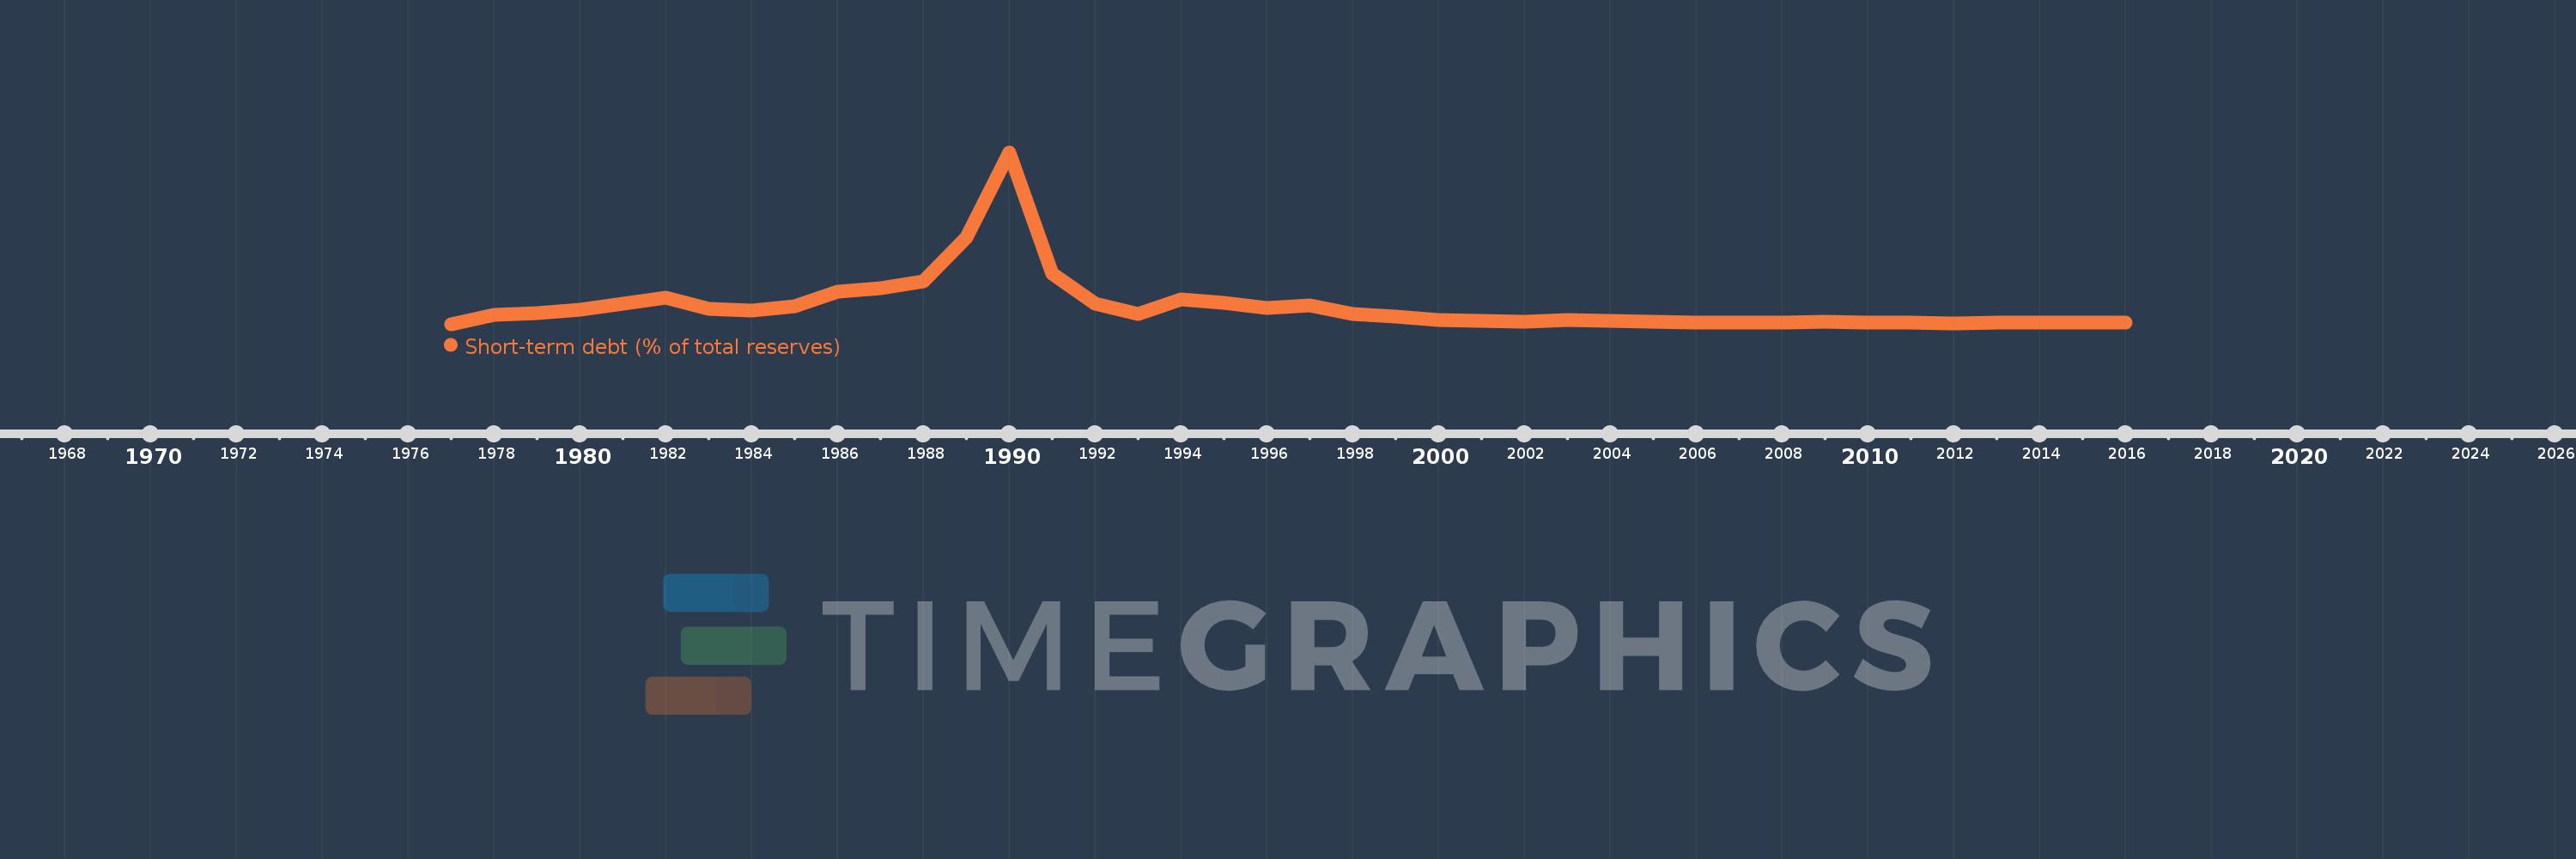
Short-term debt (% of total reserves)
2016,2015,2014,2013,2012,2011,2010,2009,2008,2007,2006,2005,2004,2003,2002,2001,2000,1999,1998,1997,1996,1995,1994,1993,1992,1991,1990,1989,1988,1987,1986,1985,1984,1983,1982,1981,1980,1979,1978,1977
Queste statistiche in altri paesi:
Linea del tempo:
Questa scala temporale mostra un grafico dal 1977 anno al 2016 anno. Honduras. I dati fino ad 1976 anno non disponibili. Il numero di osservazioni attuali secondo i date: 40.
La fonte (nome):
Indicatori dello sviluppo mondiale
La fonte (organizzazione):
World Bank, International Debt Statistics.
Categorie:
Economy & Growth, External Debt
sono stati aggiornati
23 apr 2017 anni
Indicatori delle variazioni dei valori per anni
Minima:
0.0
1 gen 1977 anni
Massimo:
1.454 Mille.
1 gen 1990 anni
Alla data di osservazione
Valore
Variazione assoluta
La variazione rispetto al valore precedente
1 gen 1977 anni
0.0
0.0
0.0%
1 gen 1978 anni
81.846
+81.846
%
1 gen 1979 anni
92.245
+10.398
12.7%
1 gen 1980 anni
122.535
+30.29
32.84%
1 gen 1981 anni
170.926
+48.391
39.49%
1 gen 1982 anni
224.951
+54.026
31.61%
1 gen 1983 anni
126.913
-98.038
-43.58%
1 gen 1984 anni
118.353
-8.56
-6.74%
1 gen 1985 anni
149.422
+31.069
26.25%
1 gen 1986 anni
272.78
+123.358
82.56%
1 gen 1987 anni
307.683
+34.903
12.8%
1 gen 1988 anni
359.471
+51.788
16.83%
1 gen 1989 anni
732.949
+373.477
103.9%
1 gen 1990 anni
1.454 Mille.
+721.3
98.41%
1 gen 1991 anni
430.843
-1.023 Mille.
-70.37%
1 gen 1992 anni
172.248
-258.595
-60.02%
1 gen 1993 anni
88.202
-84.046
-48.79%
1 gen 1994 anni
212.282
+124.08
140.68%
1 gen 1995 anni
181.245
-31.037
-14.62%
1 gen 1996 anni
141.048
-40.197
-22.18%
1 gen 1997 anni
162.856
+21.808
15.46%
1 gen 1998 anni
83.088
-79.768
-48.98%
1 gen 1999 anni
64.493
-18.595
-22.38%
1 gen 2000 anni
35.517
-28.976
-44.93%
1 gen 2001 anni
28.322
-7.196
-20.26%
1 gen 2002 anni
23.163
-5.159
-18.22%
1 gen 2003 anni
34.208
+11.045
47.69%
1 gen 2004 anni
30.049
-4.159
-12.16%
1 gen 2005 anni
21.36
-8.689
-28.92%
1 gen 2006 anni
13.739
-7.621
-35.68%
1 gen 2007 anni
10.778
-2.961
-21.55%
1 gen 2008 anni
12.446
+1.668
15.48%
1 gen 2009 anni
18.681
+6.236
50.1%
1 gen 2010 anni
11.814
-6.867
-36.76%
1 gen 2011 anni
13.856
+2.042
17.29%
1 gen 2012 anni
9.607
-4.25
-30.67%
1 gen 2013 anni
15.862
+6.255
65.11%
1 gen 2014 anni
17.014
+1.153
7.27%
1 gen 2015 anni
14.565
-2.45
-14.4%
1 gen 2016 anni
13.075
-1.49
-10.23%
Classificazione dei paesi secondo i statistiche attuali per anni


Commenti: