29
/it/
it
AIzaSyAYiBZKx7MnpbEhh9jyipgxe19OcubqV5w
April 1, 2024
204745
Myanmar
MMR
true
2
1
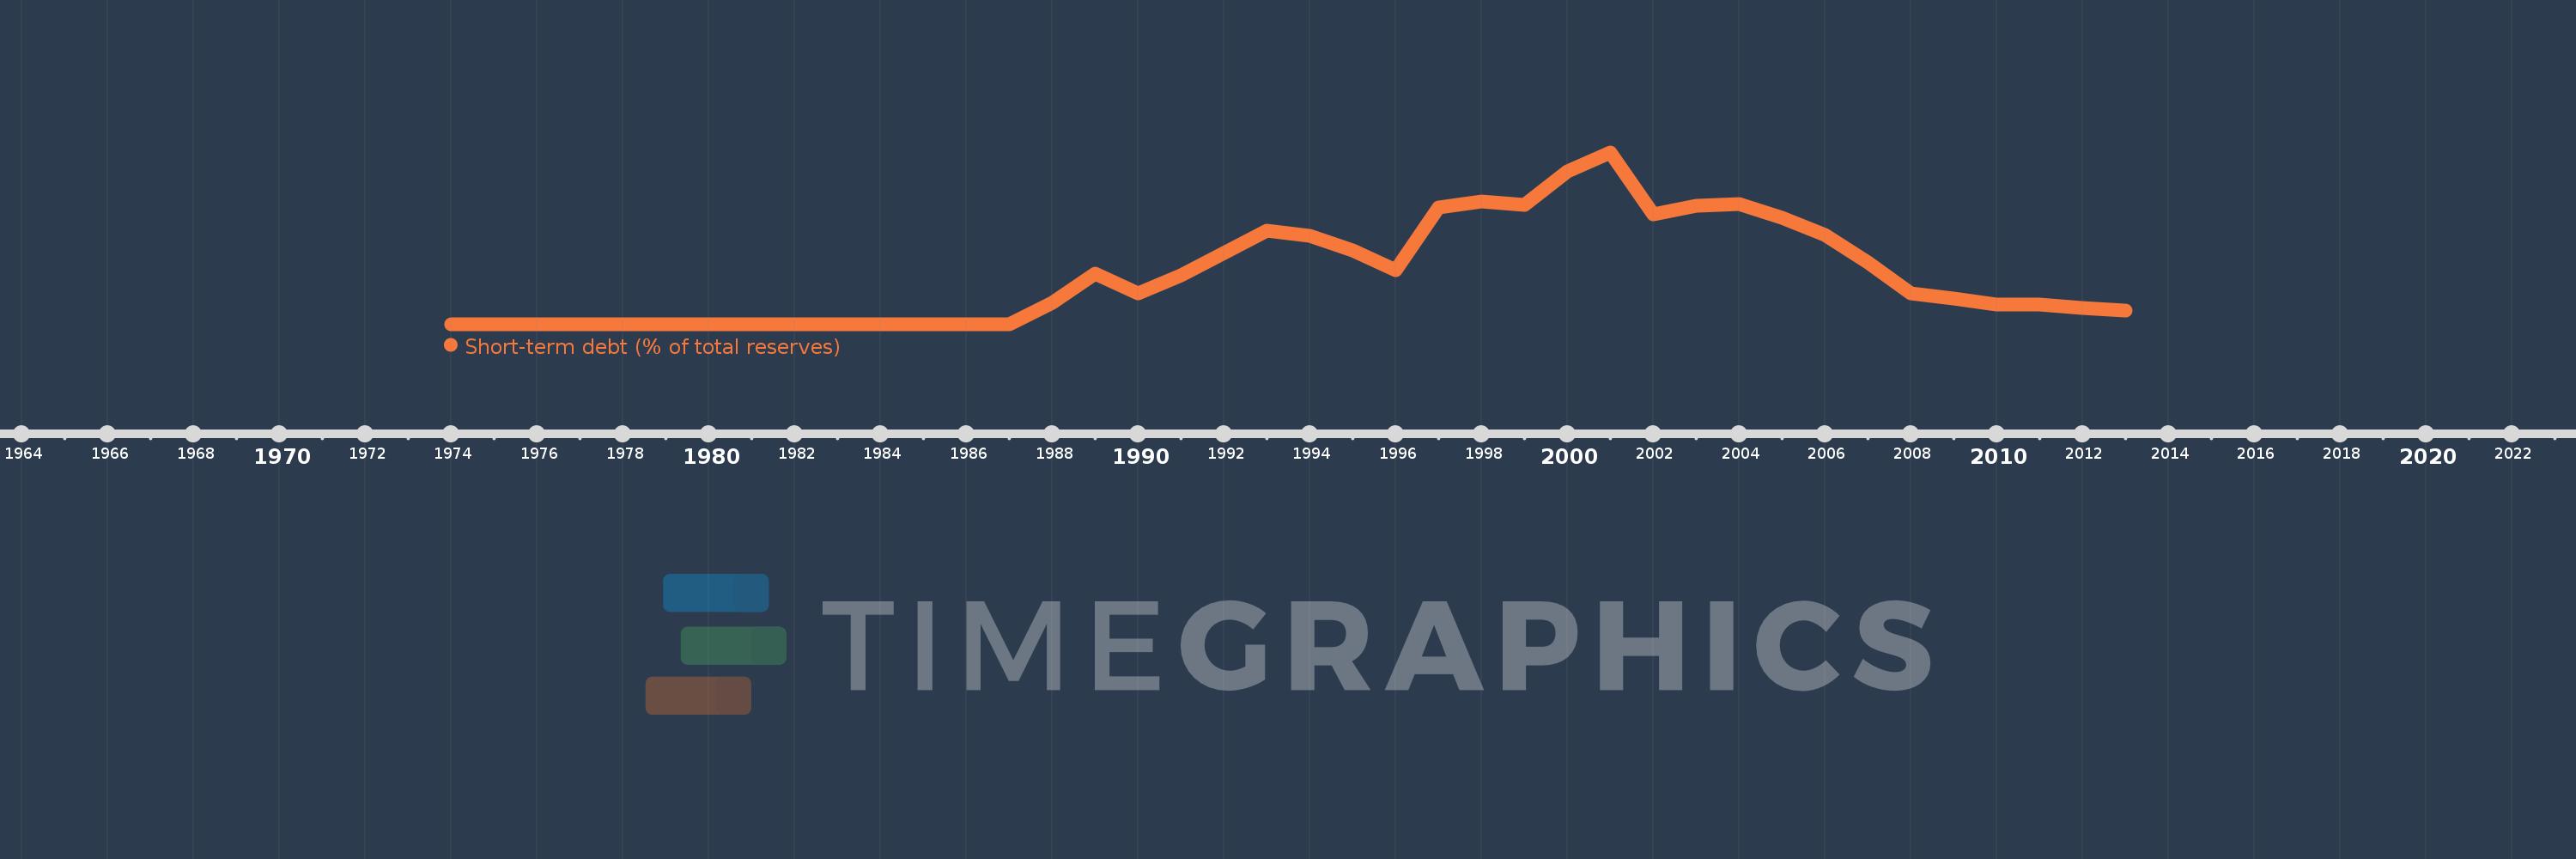
Short-term debt (% of total reserves)
2013,2012,2011,2010,2009,2008,2007,2006,2005,2004,2003,2002,2001,2000,1999,1998,1997,1996,1995,1994,1993,1992,1991,1990,1989,1988,1987,1986,1985,1984,1983,1982,1981,1980,1979,1978,1977,1976,1975,1974
Queste statistiche in altri paesi:
Linea del tempo:
Questa scala temporale mostra un grafico dal 1974 anno al 2013 anno. Myanmar. I dati fino ad 1973 anno non disponibili. Il numero di osservazioni attuali secondo i date: 40.
La fonte (nome):
Indicatori dello sviluppo mondiale
La fonte (organizzazione):
World Bank, International Debt Statistics.
Categorie:
Economy & Growth, External Debt
sono stati aggiornati
23 apr 2017 anni
Indicatori delle variazioni dei valori per anni
Minima:
0.0
1 gen 1974 anni
Massimo:
171.813
1 gen 2001 anni
Alla data di osservazione
Valore
Variazione assoluta
La variazione rispetto al valore precedente
1 gen 1974 anni
0.0
0.0
0.0%
1 gen 1977 anni
0.021
+0.021
%
1 gen 1978 anni
0.044
+0.023
113.68%
1 gen 1979 anni
0.064
+0.02
44.79%
1 gen 1980 anni
0.039
-0.025
-38.7%
1 gen 1981 anni
0.04
+0.001
2.45%
1 gen 1982 anni
0.06
+0.02
50.02%
1 gen 1983 anni
0.106
+0.046
75.86%
1 gen 1984 anni
0.124
+0.018
16.79%
1 gen 1985 anni
0.163
+0.039
31.54%
1 gen 1986 anni
0.196
+0.033
20.24%
1 gen 1987 anni
0.173
-0.023
-11.6%
1 gen 1988 anni
21.681
+21.508
12.44 Mille.%
1 gen 1989 anni
50.172
+28.491
131.41%
1 gen 1990 anni
30.456
-19.717
-39.3%
1 gen 1991 anni
49.123
+18.667
61.29%
1 gen 1992 anni
71.513
+22.39
45.58%
1 gen 1993 anni
93.571
+22.058
30.85%
1 gen 1994 anni
88.347
-5.224
-5.58%
1 gen 1995 anni
73.431
-14.915
-16.88%
1 gen 1996 anni
54.047
-19.385
-26.4%
1 gen 1997 anni
116.411
+62.364
115.39%
1 gen 1998 anni
123.145
+6.734
5.78%
1 gen 1999 anni
119.508
-3.636
-2.95%
1 gen 2000 anni
153.187
+33.679
28.18%
1 gen 2001 anni
171.813
+18.626
12.16%
1 gen 2002 anni
109.543
-62.27
-36.24%
1 gen 2003 anni
118.347
+8.804
8.04%
1 gen 2004 anni
120.547
+2.2
1.86%
1 gen 2005 anni
106.188
-14.358
-11.91%
1 gen 2006 anni
89.539
-16.649
-15.68%
1 gen 2007 anni
61.593
-27.947
-31.21%
1 gen 2008 anni
30.836
-30.757
-49.94%
1 gen 2009 anni
25.489
-5.347
-17.34%
1 gen 2010 anni
19.263
-6.226
-24.43%
1 gen 2011 anni
19.541
+0.278
1.44%
1 gen 2012 anni
16.182
-3.359
-17.19%
1 gen 2013 anni
13.284
-2.898
-17.91%
Classificazione dei paesi secondo i statistiche attuali per anni


Commenti: