29
/it/
it
AIzaSyAYiBZKx7MnpbEhh9jyipgxe19OcubqV5w
April 1, 2024
51504
Middle income
MIC
false
2
1
Short-term debt (% of total reserves)
2016,2015,2014,2013,2012,2011,2010,2009,2008,2007,2006,2005,2004,2003,2002,2001,2000,1999,1998,1997,1996,1995,1994,1993,1992,1991,1990,1989,1988,1987,1986,1985,1984,1983,1982,1981,1980,1979,1974,1973,1971
Queste statistiche in altri paesi:
Linea del tempo:
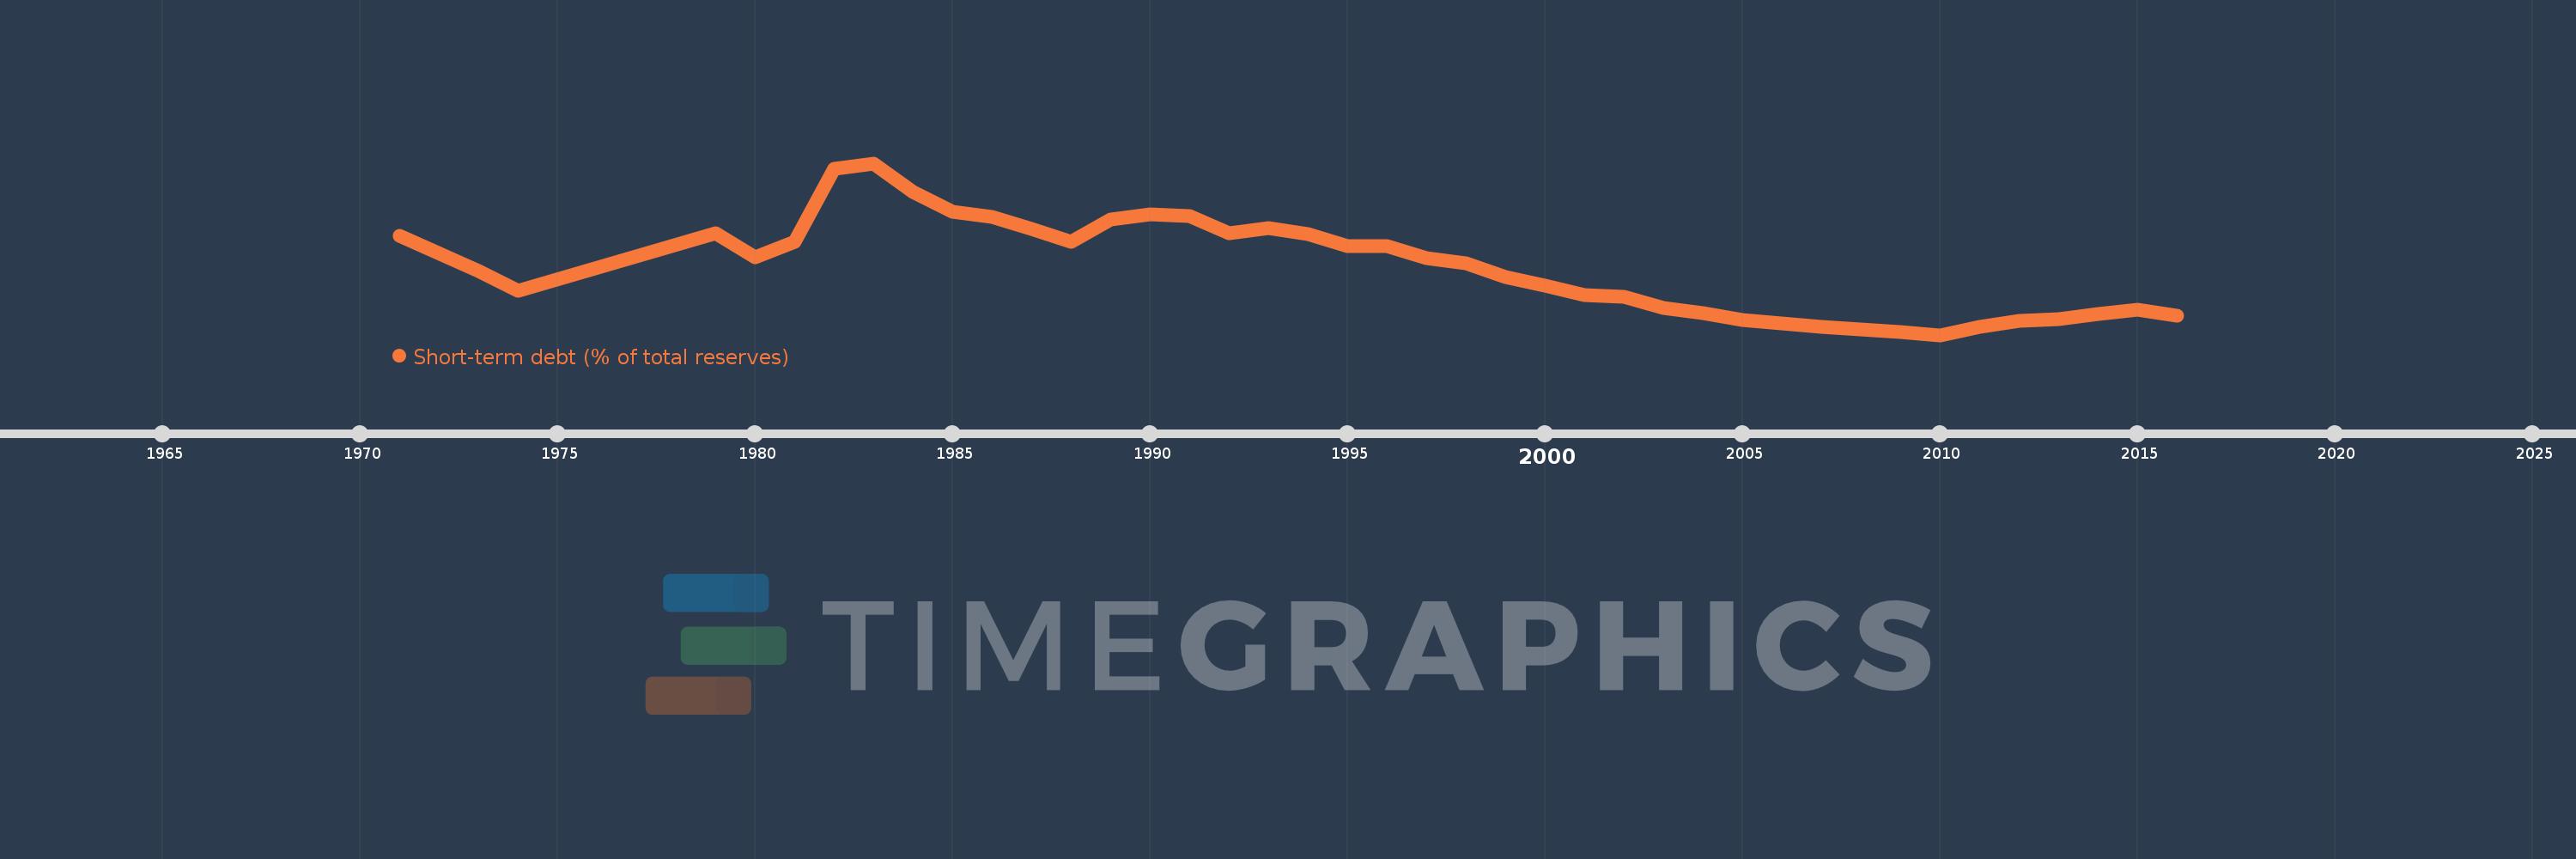
Questa scala temporale mostra un grafico dal 1971 anno al 2016 anno. Middle income. I dati fino ad 1970 anno non disponibili. Il numero di osservazioni attuali secondo i date: 41.
La fonte (nome):
Indicatori dello sviluppo mondiale
La fonte (organizzazione):
World Bank, International Debt Statistics.
Categorie:
Economy & Growth, External Debt
sono stati aggiornati
23 apr 2017 anni
Indicatori delle variazioni dei valori per anni
Minima:
16.826
1 gen 2010 anni
Massimo:
126.556
1 gen 1983 anni
Alla data di osservazione
Valore
Variazione assoluta
La variazione rispetto al valore precedente
1 gen 1971 anni
80.13
+80.13
0.0%
1 gen 1973 anni
57.737
-22.393
-27.95%
1 gen 1974 anni
44.964
-12.773
-22.12%
1 gen 1979 anni
82.084
+37.12
82.55%
1 gen 1980 anni
66.707
-15.377
-18.73%
1 gen 1981 anni
76.287
+9.58
14.36%
1 gen 1982 anni
123.218
+46.931
61.52%
1 gen 1983 anni
126.556
+3.338
2.71%
1 gen 1984 anni
108.331
-18.225
-14.4%
1 gen 1985 anni
95.8
-12.531
-11.57%
1 gen 1986 anni
92.283
-3.517
-3.67%
1 gen 1987 anni
84.742
-7.541
-8.17%
1 gen 1988 anni
76.627
-8.114
-9.58%
1 gen 1989 anni
90.743
+14.116
18.42%
1 gen 1990 anni
94.09
+3.347
3.69%
1 gen 1991 anni
92.687
-1.403
-1.49%
1 gen 1992 anni
81.683
-11.005
-11.87%
1 gen 1993 anni
85.384
+3.701
4.53%
1 gen 1994 anni
81.066
-4.318
-5.06%
1 gen 1995 anni
73.417
-7.648
-9.43%
1 gen 1996 anni
73.421
+0.003
0.0%
1 gen 1997 anni
66.179
-7.242
-9.86%
1 gen 1998 anni
62.46
-3.719
-5.62%
1 gen 1999 anni
53.906
-8.554
-13.7%
1 gen 2000 anni
48.266
-5.64
-10.46%
1 gen 2001 anni
42.526
-5.74
-11.89%
1 gen 2002 anni
41.097
-1.428
-3.36%
1 gen 2003 anni
33.939
-7.159
-17.42%
1 gen 2004 anni
30.935
-3.004
-8.85%
1 gen 2005 anni
26.584
-4.351
-14.06%
1 gen 2006 anni
24.334
-2.25
-8.46%
1 gen 2007 anni
21.899
-2.435
-10.01%
1 gen 2008 anni
20.553
-1.346
-6.15%
1 gen 2009 anni
18.798
-1.755
-8.54%
1 gen 2010 anni
16.826
-1.972
-10.49%
1 gen 2011 anni
22.235
+5.409
32.15%
1 gen 2012 anni
25.676
+3.44
15.47%
1 gen 2013 anni
26.836
+1.16
4.52%
1 gen 2014 anni
30.328
+3.492
13.01%
1 gen 2015 anni
32.74
+2.412
7.95%
1 gen 2016 anni
29.434
-3.306
-10.1%
Classificazione dei paesi secondo i statistiche attuali per anni


Commenti: