29
/it/
it
AIzaSyAYiBZKx7MnpbEhh9jyipgxe19OcubqV5w
April 1, 2024
33071
Europe & Central Asia (IDA & IBRD countries)
TEC
false
2
1
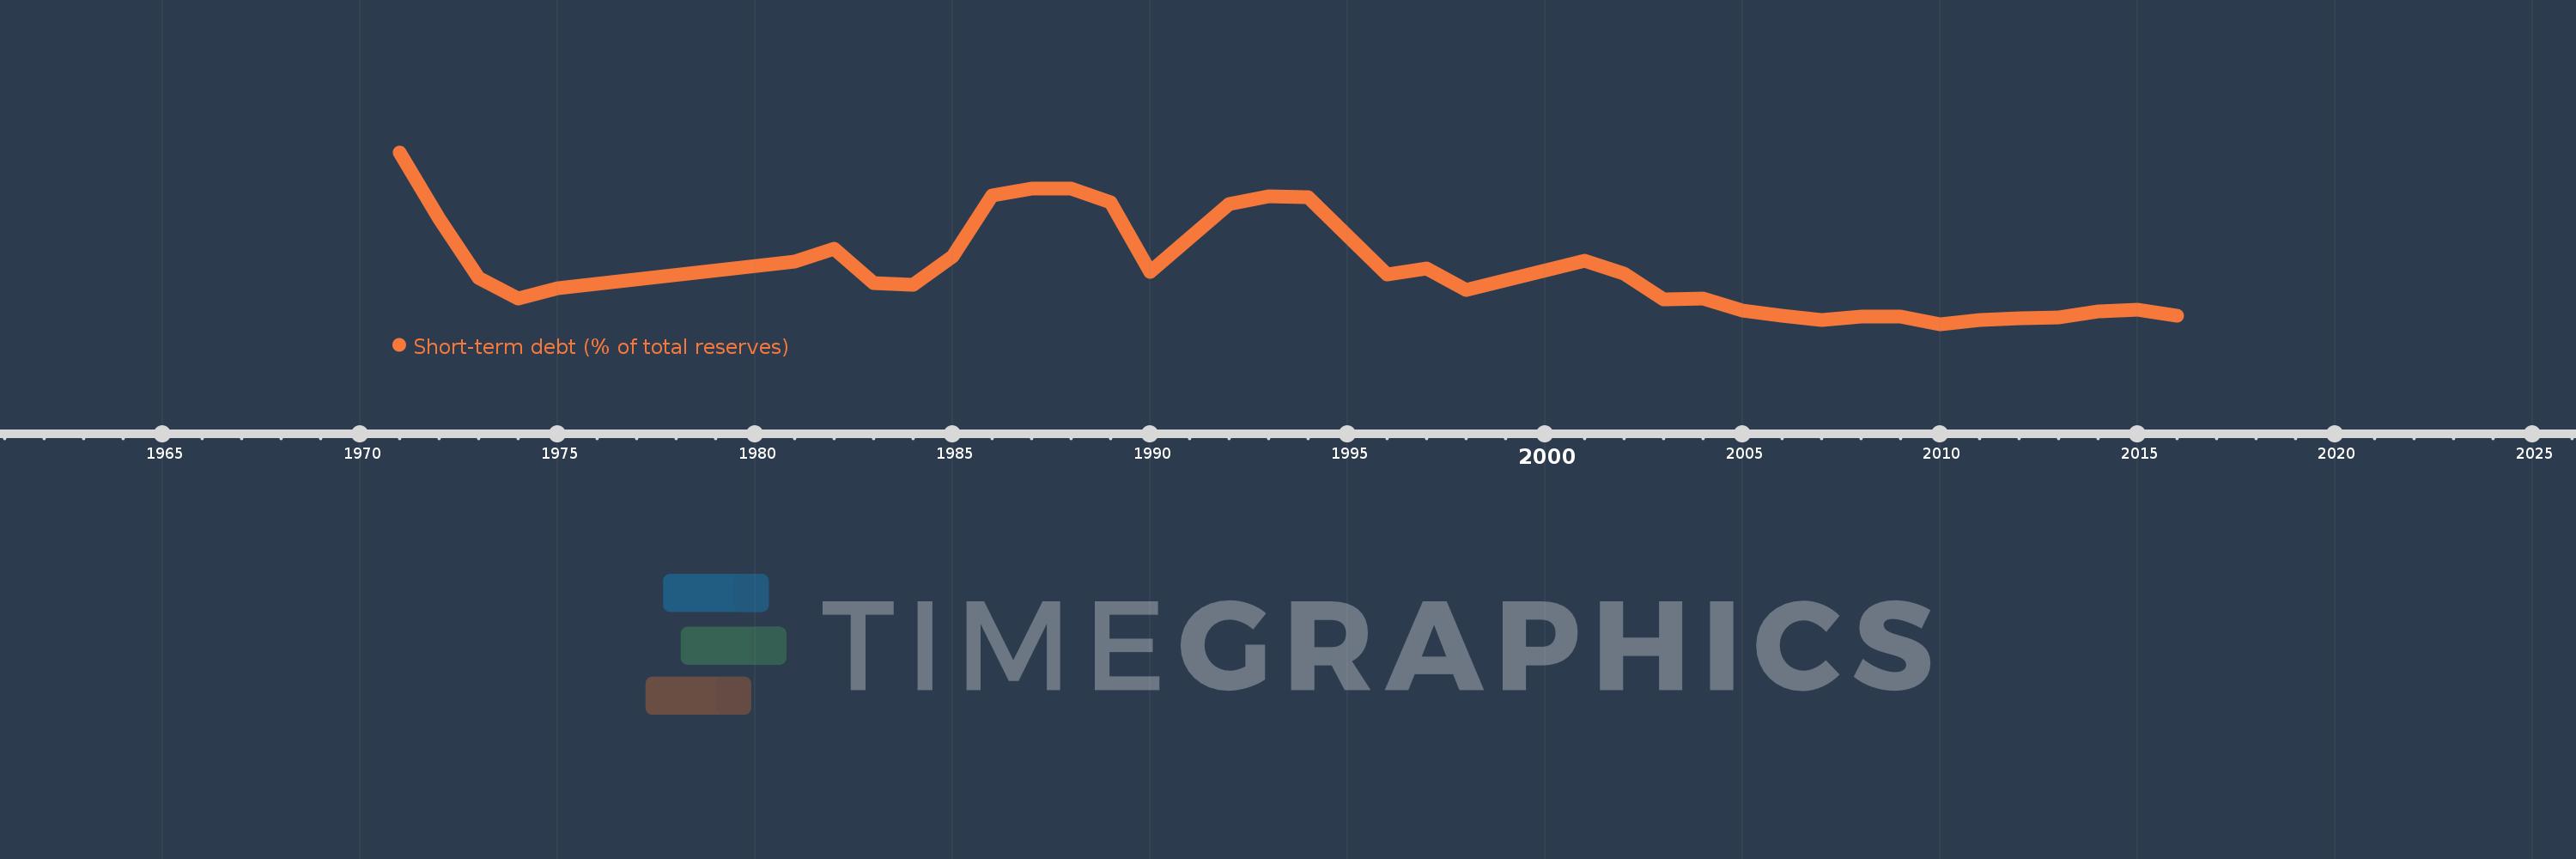
Short-term debt (% of total reserves)
2016,2015,2014,2013,2012,2011,2010,2009,2008,2007,2006,2005,2004,2003,2002,2001,1998,1997,1996,1995,1994,1993,1992,1990,1989,1988,1987,1986,1985,1984,1983,1982,1981,1975,1974,1973,1972,1971
Queste statistiche in altri paesi:
Linea del tempo:
Questa scala temporale mostra un grafico dal 1971 anno al 2016 anno. Europe & Central Asia (IDA & IBRD countries). I dati fino ad 1970 anno non disponibili. Il numero di osservazioni attuali secondo i date: 38.
La fonte (nome):
Indicatori dello sviluppo mondiale
La fonte (organizzazione):
World Bank, International Debt Statistics.
Categorie:
Economy & Growth, External Debt
sono stati aggiornati
23 apr 2017 anni
Indicatori delle variazioni dei valori per anni
Minima:
27.548
1 gen 2010 anni
Massimo:
178.281
1 gen 1971 anni
Alla data di osservazione
Valore
Variazione assoluta
La variazione rispetto al valore precedente
1 gen 1971 anni
178.281
+178.281
0.0%
1 gen 1972 anni
120.291
-57.99
-32.53%
1 gen 1973 anni
67.946
-52.345
-43.52%
1 gen 1974 anni
50.32
-17.626
-25.94%
1 gen 1975 anni
59.397
+9.076
18.04%
1 gen 1981 anni
82.704
+23.307
39.24%
1 gen 1982 anni
93.67
+10.966
13.26%
1 gen 1983 anni
63.884
-29.786
-31.8%
1 gen 1984 anni
62.211
-1.674
-2.62%
1 gen 1985 anni
87.192
+24.981
40.16%
1 gen 1986 anni
140.822
+53.631
61.51%
1 gen 1987 anni
146.225
+5.402
3.84%
1 gen 1988 anni
146.724
+0.499
0.34%
1 gen 1989 anni
134.615
-12.109
-8.25%
1 gen 1990 anni
73.465
-61.15
-45.43%
1 gen 1992 anni
133.0
+59.535
81.04%
1 gen 1993 anni
139.694
+6.694
5.03%
1 gen 1994 anni
138.798
-0.896
-0.64%
1 gen 1995 anni
104.871
-33.927
-24.44%
1 gen 1996 anni
71.139
-33.733
-32.17%
1 gen 1997 anni
76.609
+5.47
7.69%
1 gen 1998 anni
57.911
-18.698
-24.41%
1 gen 2001 anni
83.608
+25.698
44.37%
1 gen 2002 anni
71.862
-11.746
-14.05%
1 gen 2003 anni
49.609
-22.253
-30.97%
1 gen 2004 anni
50.353
+0.744
1.5%
1 gen 2005 anni
39.217
-11.136
-22.12%
1 gen 2006 anni
34.767
-4.45
-11.35%
1 gen 2007 anni
30.874
-3.894
-11.2%
1 gen 2008 anni
34.002
+3.129
10.13%
1 gen 2009 anni
34.186
+0.184
0.54%
1 gen 2010 anni
27.548
-6.638
-19.42%
1 gen 2011 anni
31.126
+3.578
12.99%
1 gen 2012 anni
32.674
+1.547
4.97%
1 gen 2013 anni
33.848
+1.175
3.6%
1 gen 2014 anni
38.796
+4.947
14.62%
1 gen 2015 anni
40.606
+1.811
4.67%
1 gen 2016 anni
34.664
-5.942
-14.63%
Classificazione dei paesi secondo i statistiche attuali per anni


Commenti: