29
/it/
it
AIzaSyAYiBZKx7MnpbEhh9jyipgxe19OcubqV5w
April 1, 2024
81608
Belgium
BEL
true
2
1
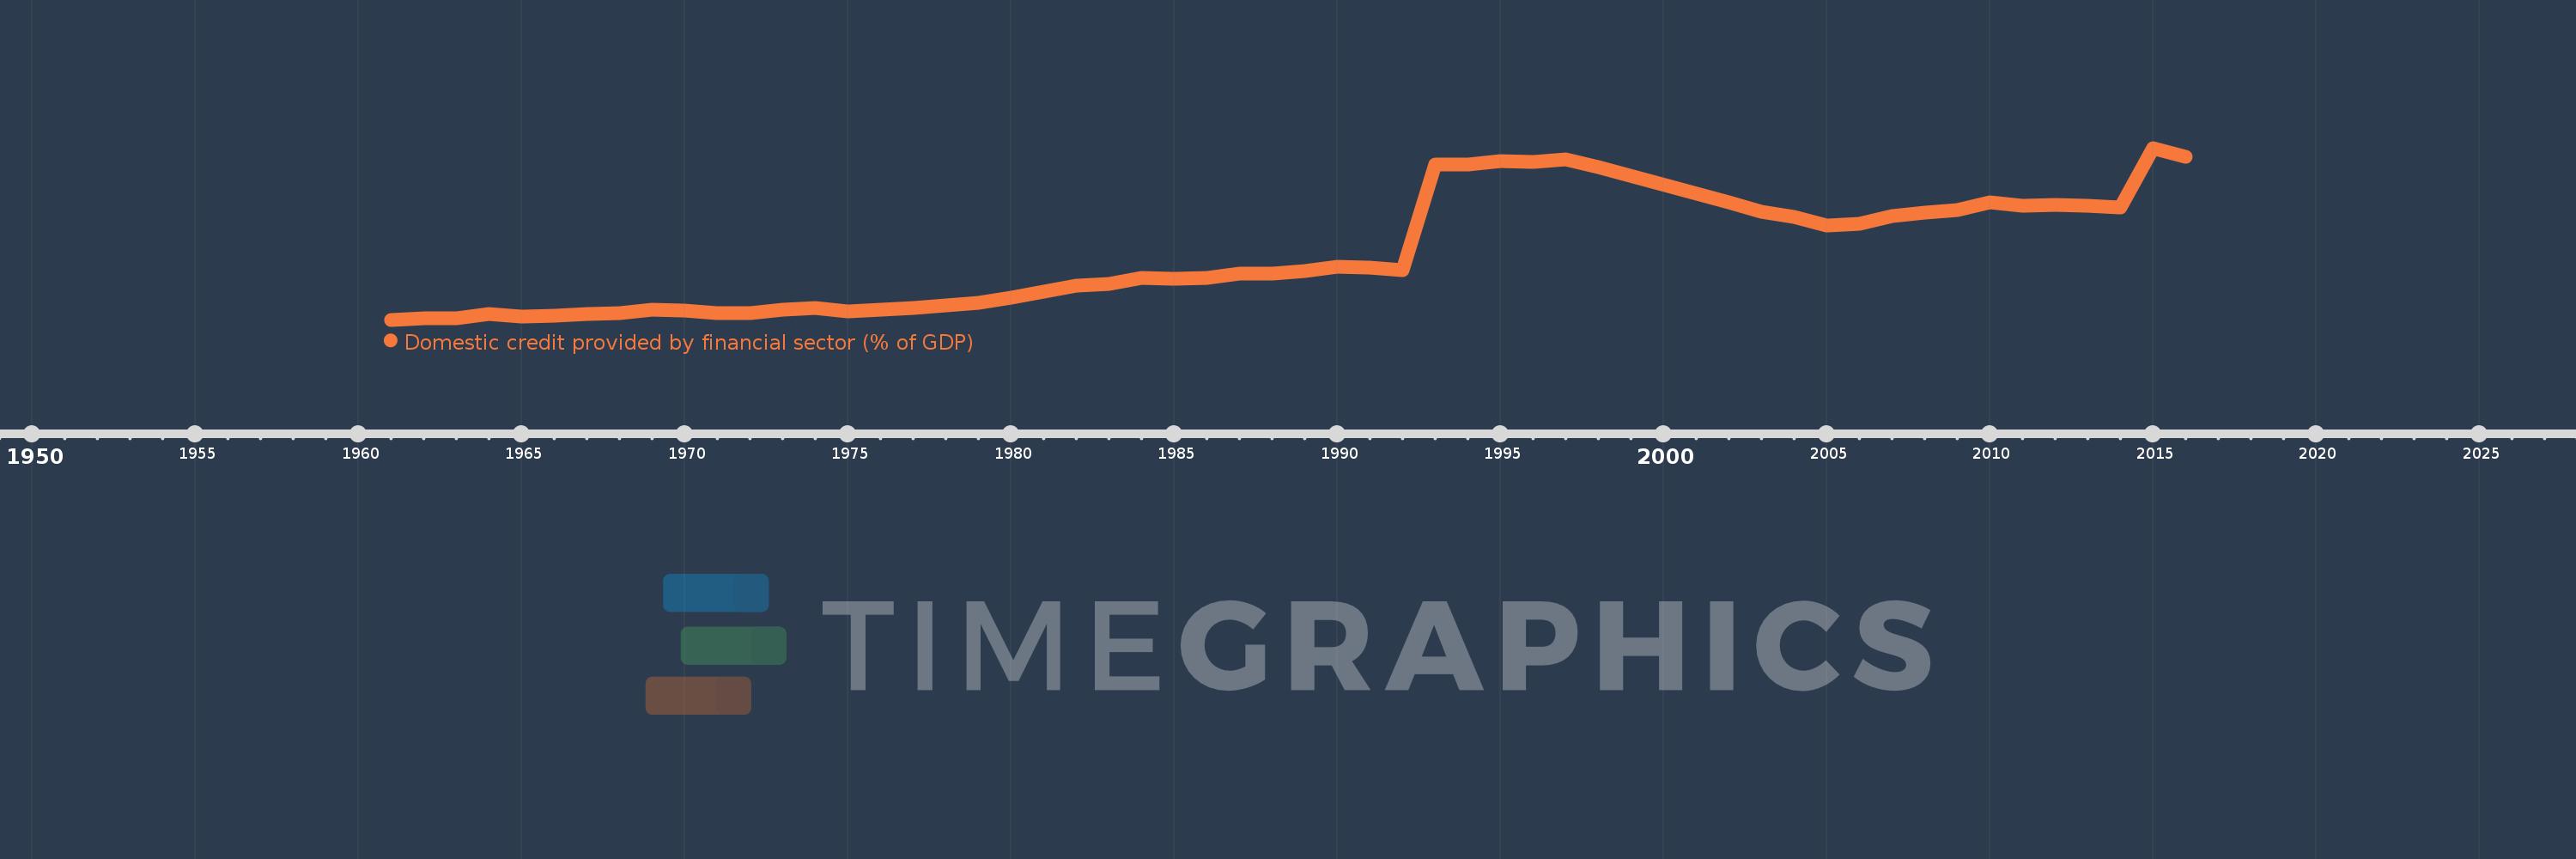
Domestic credit provided by financial sector (% of GDP)
2016,2015,2014,2013,2012,2011,2010,2009,2008,2007,2006,2005,2004,2003,2002,1998,1997,1996,1995,1994,1993,1992,1991,1990,1989,1988,1987,1986,1985,1984,1983,1982,1981,1980,1979,1978,1977,1976,1975,1974,1973,1972,1971,1970,1969,1968,1967,1966,1965,1964,1963,1962,1961
Queste statistiche in altri paesi:
AfghanistanAlbaniaAlgeriaAngolaAntigua and BarbudaArab WorldArgentinaArmeniaArubaAustraliaAustriaAzerbaijanBahamas, TheBahrainBangladeshBarbadosBelarusBelgiumBelizeBeninBhutanBoliviaBosnia and HerzegovinaBotswanaBrazilBrunei DarussalamBulgariaBurkina FasoBurundiCabo VerdeCambodiaCameroonCanadaCaribbean small statesCentral African RepublicCentral Europe and the BalticsChadChileChinaColombiaComorosCongo, Dem. Rep.Congo, Rep.Costa RicaCote d'IvoireCroatiaCyprusCzech RepublicDenmarkDjiboutiDominicaDominican RepublicEarly-demographic dividendEast Asia & PacificEast Asia & Pacific (excluding high income)East Asia & Pacific (IDA & IBRD countries)EcuadorEgypt, Arab Rep.El SalvadorEquatorial GuineaEritreaEstoniaEthiopiaEuro areaEurope & Central AsiaEurope & Central Asia (excluding high income)Europe & Central Asia (IDA & IBRD countries)European UnionFijiFinlandFragile and conflict affected situationsFranceGabonGambia, TheGeorgiaGermanyGhanaGreeceGrenadaGuatemalaGuineaGuinea-BissauGuyanaHaitiHeavily indebted poor countries (HIPC)High incomeHondurasHong Kong SAR, ChinaHungaryIBRD onlyIcelandIDA & IBRD totalIDA blendIDA onlyIDA totalIndiaIndonesiaIran, Islamic Rep.IraqIrelandIsraelItalyJamaicaJapanJordanKazakhstanKenyaKorea, Rep.KosovoKuwaitKyrgyz RepublicLao PDRLate-demographic dividendLatin America & Caribbean Latin America & Caribbean (excluding high income)Latin America & the Caribbean (IDA & IBRD countries)LatviaLeast developed countries: UN classificationLebanonLesothoLiberiaLibyaLithuaniaLow & middle incomeLow incomeLower middle incomeLuxembourgMacao SAR, ChinaMacedonia, FYRMadagascarMalawiMalaysiaMaldivesMaliMaltaMauritaniaMauritiusMexicoMicronesia, Fed. Sts.Middle East & North AfricaMiddle East & North Africa (excluding high income)Middle East & North Africa (IDA & IBRD countries)Middle incomeMoldovaMongoliaMontenegroMoroccoMozambiqueMyanmarNamibiaNepalNetherlandsNew ZealandNicaraguaNigerNigeriaNorth AmericaNorwayOECD membersOmanOther small statesPacific island small statesPakistanPanamaPapua New GuineaParaguayPeruPhilippinesPolandPortugalPost-demographic dividendPre-demographic dividendQatarRomaniaRussian FederationRwandaSamoaSao Tome and PrincipeSaudi ArabiaSenegalSerbiaSeychellesSierra LeoneSingaporeSlovak RepublicSloveniaSmall statesSolomon IslandsSouth AfricaSouth AsiaSouth Asia (IDA & IBRD)South SudanSpainSri LankaSt. Kitts and NevisSt. LuciaSt. Vincent and the GrenadinesSub-Saharan Africa Sub-Saharan Africa (excluding high income)Sub-Saharan Africa (IDA & IBRD countries)SudanSurinameSwazilandSwedenSwitzerlandSyrian Arab RepublicTajikistanTanzaniaThailandTimor-LesteTogoTongaTrinidad and TobagoTunisiaTurkeyUgandaUkraineUnited Arab EmiratesUnited KingdomUnited StatesUpper middle incomeUruguayVanuatuVenezuela, RBVietnamWest Bank and GazaWorldYemen, Rep.ZambiaZimbabwe Linea del tempo:
Questa scala temporale mostra un grafico dal 1961 anno al 2016 anno. Belgium. I dati fino ad 1960 anno non disponibili. Il numero di osservazioni attuali secondo i date: 53.
La fonte (nome):
Indicatori dello sviluppo mondiale
La fonte (organizzazione):
International Monetary Fund, International Financial Statistics and data files, and World Bank and OECD GDP estimates.
Categorie:
Financial Sector
sono stati aggiornati
23 apr 2017 anni
Indicatori delle variazioni dei valori per anni
Minima:
33.005
1 gen 1961 anni
Massimo:
154.24
1 gen 2015 anni
Alla data di osservazione
Valore
Variazione assoluta
La variazione rispetto al valore precedente
1 gen 1961 anni
33.005
+33.005
0.0%
1 gen 1962 anni
34.193
+1.188
3.6%
1 gen 1963 anni
34.333
+0.14
0.41%
1 gen 1964 anni
37.125
+2.791
8.13%
1 gen 1965 anni
35.401
-1.724
-4.64%
1 gen 1966 anni
35.553
+0.152
0.43%
1 gen 1967 anni
36.854
+1.302
3.66%
1 gen 1968 anni
37.445
+0.591
1.6%
1 gen 1969 anni
40.054
+2.609
6.97%
1 gen 1970 anni
39.501
-0.553
-1.38%
1 gen 1971 anni
37.713
-1.788
-4.53%
1 gen 1972 anni
37.83
+0.116
0.31%
1 gen 1973 anni
40.09
+2.261
5.98%
1 gen 1974 anni
41.5
+1.41
3.52%
1 gen 1975 anni
39.092
-2.408
-5.8%
1 gen 1976 anni
40.207
+1.115
2.85%
1 gen 1977 anni
41.249
+1.042
2.59%
1 gen 1978 anni
43.326
+2.077
5.04%
1 gen 1979 anni
44.961
+1.635
3.77%
1 gen 1980 anni
48.709
+3.748
8.34%
1 gen 1981 anni
52.596
+3.886
7.98%
1 gen 1982 anni
56.823
+4.228
8.04%
1 gen 1983 anni
58.417
+1.594
2.8%
1 gen 1984 anni
62.684
+4.268
7.31%
1 gen 1985 anni
61.963
-0.722
-1.15%
1 gen 1986 anni
62.769
+0.806
1.3%
1 gen 1987 anni
65.339
+2.57
4.09%
1 gen 1988 anni
65.859
+0.52
0.8%
1 gen 1989 anni
67.199
+1.34
2.03%
1 gen 1990 anni
70.355
+3.156
4.7%
1 gen 1991 anni
69.842
-0.513
-0.73%
1 gen 1992 anni
67.933
-1.909
-2.73%
1 gen 1993 anni
142.265
+74.332
109.42%
1 gen 1994 anni
142.544
+0.279
0.2%
1 gen 1995 anni
144.984
+2.44
1.71%
1 gen 1996 anni
144.34
-0.644
-0.44%
1 gen 1997 anni
146.116
+1.776
1.23%
1 gen 1998 anni
140.79
-5.326
-3.64%
1 gen 2002 anni
116.121
-24.67
-17.52%
1 gen 2003 anni
109.371
-6.75
-5.81%
1 gen 2004 anni
105.452
-3.918
-3.58%
1 gen 2005 anni
99.625
-5.828
-5.53%
1 gen 2006 anni
100.753
+1.128
1.13%
1 gen 2007 anni
106.0
+5.247
5.21%
1 gen 2008 anni
108.787
+2.786
2.63%
1 gen 2009 anni
110.601
+1.815
1.67%
1 gen 2010 anni
116.054
+5.452
4.93%
1 gen 2011 anni
113.679
-2.374
-2.05%
1 gen 2012 anni
114.001
+0.322
0.28%
1 gen 2013 anni
113.235
-0.766
-0.67%
1 gen 2014 anni
112.242
-0.992
-0.88%
1 gen 2015 anni
154.24
+41.997
37.42%
1 gen 2016 anni
147.911
-6.329
-4.1%
Classificazione dei paesi secondo i statistiche attuali per anni


Commenti: