29
/it/
it
AIzaSyAYiBZKx7MnpbEhh9jyipgxe19OcubqV5w
April 1, 2024
105844
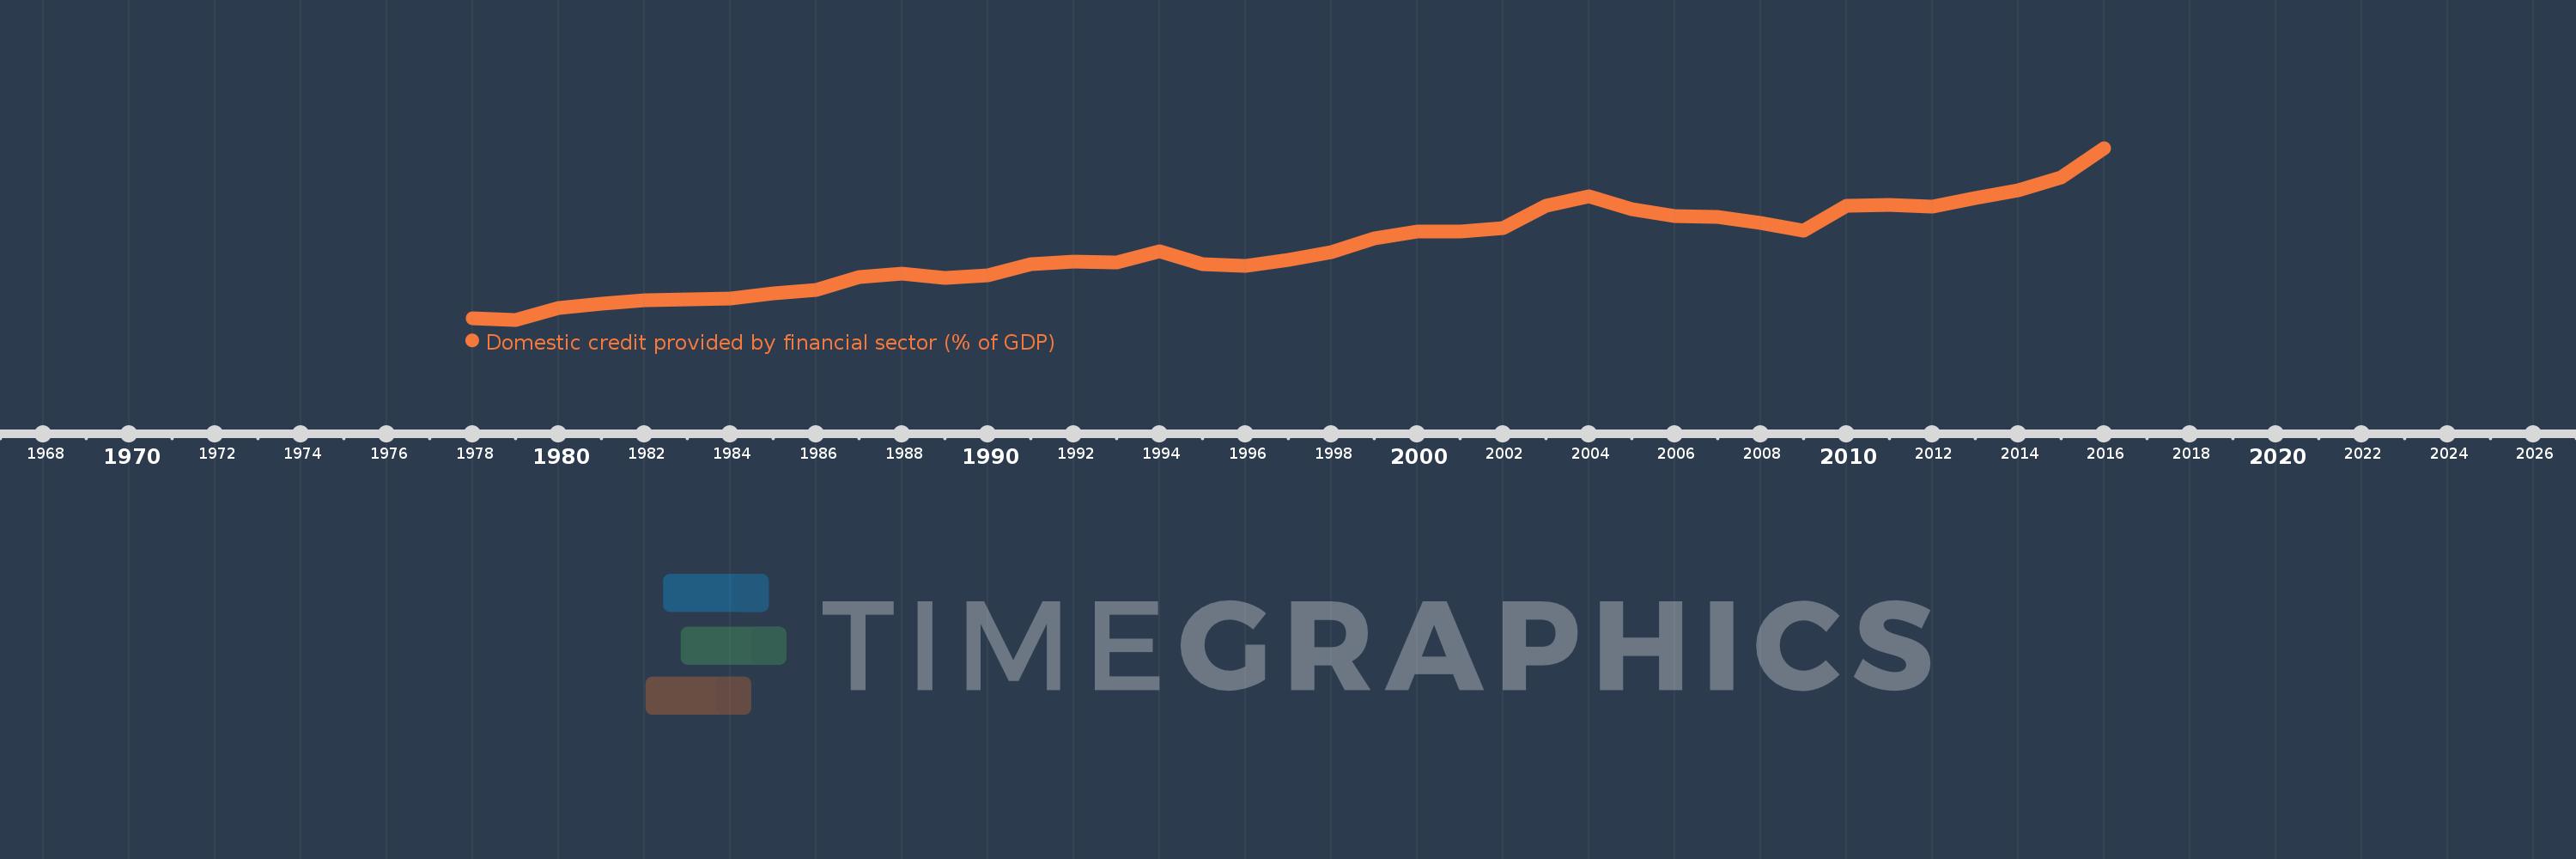
China
CHN
true
2
1
Domestic credit provided by financial sector (% of GDP)
2016,2015,2014,2013,2012,2011,2010,2009,2008,2007,2006,2005,2004,2003,2002,2001,2000,1999,1998,1997,1996,1995,1994,1993,1992,1991,1990,1989,1988,1987,1986,1985,1984,1983,1982,1981,1980,1979,1978
Queste statistiche in altri paesi:
AfghanistanAlbaniaAlgeriaAngolaAntigua and BarbudaArab WorldArgentinaArmeniaArubaAustraliaAustriaAzerbaijanBahamas, TheBahrainBangladeshBarbadosBelarusBelgiumBelizeBeninBhutanBoliviaBosnia and HerzegovinaBotswanaBrazilBrunei DarussalamBulgariaBurkina FasoBurundiCabo VerdeCambodiaCameroonCanadaCaribbean small statesCentral African RepublicCentral Europe and the BalticsChadChileChinaColombiaComorosCongo, Dem. Rep.Congo, Rep.Costa RicaCote d'IvoireCroatiaCyprusCzech RepublicDenmarkDjiboutiDominicaDominican RepublicEarly-demographic dividendEast Asia & PacificEast Asia & Pacific (excluding high income)East Asia & Pacific (IDA & IBRD countries)EcuadorEgypt, Arab Rep.El SalvadorEquatorial GuineaEritreaEstoniaEthiopiaEuro areaEurope & Central AsiaEurope & Central Asia (excluding high income)Europe & Central Asia (IDA & IBRD countries)European UnionFijiFinlandFragile and conflict affected situationsFranceGabonGambia, TheGeorgiaGermanyGhanaGreeceGrenadaGuatemalaGuineaGuinea-BissauGuyanaHaitiHeavily indebted poor countries (HIPC)High incomeHondurasHong Kong SAR, ChinaHungaryIBRD onlyIcelandIDA & IBRD totalIDA blendIDA onlyIDA totalIndiaIndonesiaIran, Islamic Rep.IraqIrelandIsraelItalyJamaicaJapanJordanKazakhstanKenyaKorea, Rep.KosovoKuwaitKyrgyz RepublicLao PDRLate-demographic dividendLatin America & Caribbean Latin America & Caribbean (excluding high income)Latin America & the Caribbean (IDA & IBRD countries)LatviaLeast developed countries: UN classificationLebanonLesothoLiberiaLibyaLithuaniaLow & middle incomeLow incomeLower middle incomeLuxembourgMacao SAR, ChinaMacedonia, FYRMadagascarMalawiMalaysiaMaldivesMaliMaltaMauritaniaMauritiusMexicoMicronesia, Fed. Sts.Middle East & North AfricaMiddle East & North Africa (excluding high income)Middle East & North Africa (IDA & IBRD countries)Middle incomeMoldovaMongoliaMontenegroMoroccoMozambiqueMyanmarNamibiaNepalNetherlandsNew ZealandNicaraguaNigerNigeriaNorth AmericaNorwayOECD membersOmanOther small statesPacific island small statesPakistanPanamaPapua New GuineaParaguayPeruPhilippinesPolandPortugalPost-demographic dividendPre-demographic dividendQatarRomaniaRussian FederationRwandaSamoaSao Tome and PrincipeSaudi ArabiaSenegalSerbiaSeychellesSierra LeoneSingaporeSlovak RepublicSloveniaSmall statesSolomon IslandsSouth AfricaSouth AsiaSouth Asia (IDA & IBRD)South SudanSpainSri LankaSt. Kitts and NevisSt. LuciaSt. Vincent and the GrenadinesSub-Saharan Africa Sub-Saharan Africa (excluding high income)Sub-Saharan Africa (IDA & IBRD countries)SudanSurinameSwazilandSwedenSwitzerlandSyrian Arab RepublicTajikistanTanzaniaThailandTimor-LesteTogoTongaTrinidad and TobagoTunisiaTurkeyUgandaUkraineUnited Arab EmiratesUnited KingdomUnited StatesUpper middle incomeUruguayVanuatuVenezuela, RBVietnamWest Bank and GazaWorldYemen, Rep.ZambiaZimbabwe Linea del tempo:
Questa scala temporale mostra un grafico dal 1978 anno al 2016 anno. China. I dati fino ad 1977 anno non disponibili. Il numero di osservazioni attuali secondo i date: 39.
La fonte (nome):
Indicatori dello sviluppo mondiale
La fonte (organizzazione):
International Monetary Fund, International Financial Statistics and data files, and World Bank and OECD GDP estimates.
Categorie:
Financial Sector
sono stati aggiornati
23 apr 2017 anni
Indicatori delle variazioni dei valori per anni
Minima:
37.869
1 gen 1979 anni
Massimo:
194.41
1 gen 2016 anni
Alla data di osservazione
Valore
Variazione assoluta
La variazione rispetto al valore precedente
1 gen 1978 anni
38.843
+38.843
0.0%
1 gen 1979 anni
37.869
-0.974
-2.51%
1 gen 1980 anni
48.314
+10.444
27.58%
1 gen 1981 anni
52.805
+4.492
9.3%
1 gen 1982 anni
55.511
+2.705
5.12%
1 gen 1983 anni
56.7
+1.189
2.14%
1 gen 1984 anni
57.084
+0.385
0.68%
1 gen 1985 anni
62.025
+4.941
8.65%
1 gen 1986 anni
65.167
+3.142
5.07%
1 gen 1987 anni
76.539
+11.371
17.45%
1 gen 1988 anni
79.746
+3.207
4.19%
1 gen 1989 anni
75.995
-3.75
-4.7%
1 gen 1990 anni
78.569
+2.574
3.39%
1 gen 1991 anni
88.429
+9.861
12.55%
1 gen 1992 anni
91.007
+2.578
2.92%
1 gen 1993 anni
90.089
-0.918
-1.01%
1 gen 1994 anni
100.221
+10.132
11.25%
1 gen 1995 anni
88.622
-11.599
-11.57%
1 gen 1996 anni
86.923
-1.699
-1.92%
1 gen 1997 anni
92.492
+5.569
6.41%
1 gen 1998 anni
99.785
+7.293
7.88%
1 gen 1999 anni
112.058
+12.274
12.3%
1 gen 2000 anni
118.162
+6.104
5.45%
1 gen 2001 anni
118.4
+0.238
0.2%
1 gen 2002 anni
121.66
+3.259
2.75%
1 gen 2003 anni
141.824
+20.164
16.57%
1 gen 2004 anni
150.11
+8.285
5.84%
1 gen 2005 anni
138.667
-11.443
-7.62%
1 gen 2006 anni
132.591
-6.077
-4.38%
1 gen 2007 anni
131.58
-1.01
-0.76%
1 gen 2008 anni
125.692
-5.889
-4.48%
1 gen 2009 anni
118.736
-6.956
-5.53%
1 gen 2010 anni
141.68
+22.945
19.32%
1 gen 2011 anni
142.199
+0.518
0.37%
1 gen 2012 anni
140.603
-1.596
-1.12%
1 gen 2013 anni
149.083
+8.48
6.03%
1 gen 2014 anni
155.736
+6.653
4.46%
1 gen 2015 anni
167.237
+11.501
7.39%
1 gen 2016 anni
194.41
+27.173
16.25%
Classificazione dei paesi secondo i statistiche attuali per anni


Commenti: