29
/it/
it
AIzaSyAYiBZKx7MnpbEhh9jyipgxe19OcubqV5w
April 1, 2024
212833
Nigeria
NGA
true
2
1
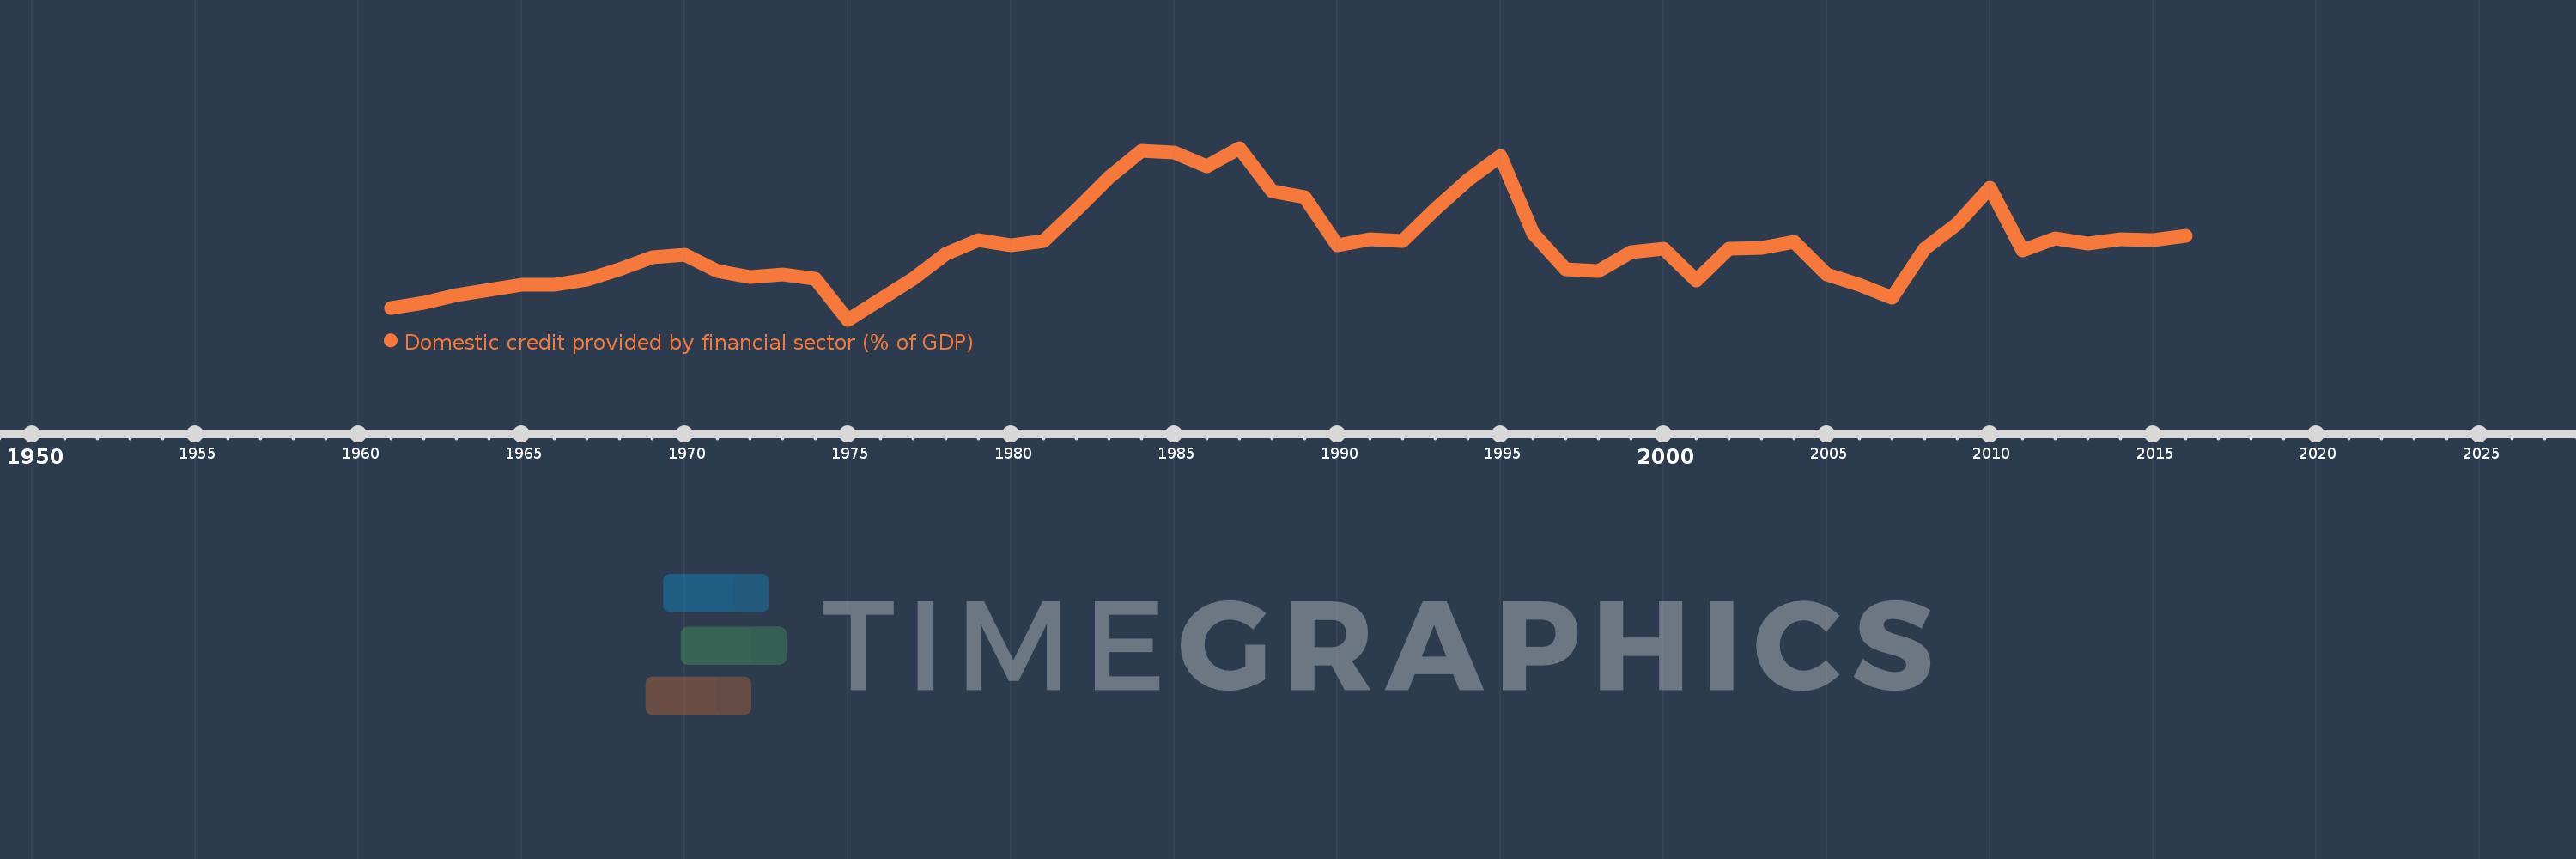
Domestic credit provided by financial sector (% of GDP)
2016,2015,2014,2013,2012,2011,2010,2009,2008,2007,2006,2005,2004,2003,2002,2001,2000,1999,1998,1997,1996,1995,1994,1993,1992,1991,1990,1989,1988,1987,1986,1985,1984,1983,1982,1981,1980,1979,1978,1977,1976,1975,1974,1973,1972,1971,1970,1969,1968,1967,1966,1965,1964,1963,1962,1961
Queste statistiche in altri paesi:
AfghanistanAlbaniaAlgeriaAngolaAntigua and BarbudaArab WorldArgentinaArmeniaArubaAustraliaAustriaAzerbaijanBahamas, TheBahrainBangladeshBarbadosBelarusBelgiumBelizeBeninBhutanBoliviaBosnia and HerzegovinaBotswanaBrazilBrunei DarussalamBulgariaBurkina FasoBurundiCabo VerdeCambodiaCameroonCanadaCaribbean small statesCentral African RepublicCentral Europe and the BalticsChadChileChinaColombiaComorosCongo, Dem. Rep.Congo, Rep.Costa RicaCote d'IvoireCroatiaCyprusCzech RepublicDenmarkDjiboutiDominicaDominican RepublicEarly-demographic dividendEast Asia & PacificEast Asia & Pacific (excluding high income)East Asia & Pacific (IDA & IBRD countries)EcuadorEgypt, Arab Rep.El SalvadorEquatorial GuineaEritreaEstoniaEthiopiaEuro areaEurope & Central AsiaEurope & Central Asia (excluding high income)Europe & Central Asia (IDA & IBRD countries)European UnionFijiFinlandFragile and conflict affected situationsFranceGabonGambia, TheGeorgiaGermanyGhanaGreeceGrenadaGuatemalaGuineaGuinea-BissauGuyanaHaitiHeavily indebted poor countries (HIPC)High incomeHondurasHong Kong SAR, ChinaHungaryIBRD onlyIcelandIDA & IBRD totalIDA blendIDA onlyIDA totalIndiaIndonesiaIran, Islamic Rep.IraqIrelandIsraelItalyJamaicaJapanJordanKazakhstanKenyaKorea, Rep.KosovoKuwaitKyrgyz RepublicLao PDRLate-demographic dividendLatin America & Caribbean Latin America & Caribbean (excluding high income)Latin America & the Caribbean (IDA & IBRD countries)LatviaLeast developed countries: UN classificationLebanonLesothoLiberiaLibyaLithuaniaLow & middle incomeLow incomeLower middle incomeLuxembourgMacao SAR, ChinaMacedonia, FYRMadagascarMalawiMalaysiaMaldivesMaliMaltaMauritaniaMauritiusMexicoMicronesia, Fed. Sts.Middle East & North AfricaMiddle East & North Africa (excluding high income)Middle East & North Africa (IDA & IBRD countries)Middle incomeMoldovaMongoliaMontenegroMoroccoMozambiqueMyanmarNamibiaNepalNetherlandsNew ZealandNicaraguaNigerNigeriaNorth AmericaNorwayOECD membersOmanOther small statesPacific island small statesPakistanPanamaPapua New GuineaParaguayPeruPhilippinesPolandPortugalPost-demographic dividendPre-demographic dividendQatarRomaniaRussian FederationRwandaSamoaSao Tome and PrincipeSaudi ArabiaSenegalSerbiaSeychellesSierra LeoneSingaporeSlovak RepublicSloveniaSmall statesSolomon IslandsSouth AfricaSouth AsiaSouth Asia (IDA & IBRD)South SudanSpainSri LankaSt. Kitts and NevisSt. LuciaSt. Vincent and the GrenadinesSub-Saharan Africa Sub-Saharan Africa (excluding high income)Sub-Saharan Africa (IDA & IBRD countries)SudanSurinameSwazilandSwedenSwitzerlandSyrian Arab RepublicTajikistanTanzaniaThailandTimor-LesteTogoTongaTrinidad and TobagoTunisiaTurkeyUgandaUkraineUnited Arab EmiratesUnited KingdomUnited StatesUpper middle incomeUruguayVanuatuVenezuela, RBVietnamWest Bank and GazaWorldYemen, Rep.ZambiaZimbabwe Linea del tempo:
Questa scala temporale mostra un grafico dal 1961 anno al 2016 anno. Nigeria. I dati fino ad 1960 anno non disponibili. Il numero di osservazioni attuali secondo i date: 56.
La fonte (nome):
Indicatori dello sviluppo mondiale
La fonte (organizzazione):
International Monetary Fund, International Financial Statistics and data files, and World Bank and OECD GDP estimates.
Categorie:
Financial Sector
sono stati aggiornati
23 apr 2017 anni
Indicatori delle variazioni dei valori per anni
Minima:
-1.602
1 gen 1975 anni
Massimo:
48.672
1 gen 1987 anni
Alla data di osservazione
Valore
Variazione assoluta
La variazione rispetto al valore precedente
1 gen 1961 anni
1.785
+1.785
0.0%
1 gen 1962 anni
3.309
+1.524
85.4%
1 gen 1963 anni
5.629
+2.32
70.1%
1 gen 1964 anni
7.163
+1.534
27.25%
1 gen 1965 anni
8.506
+1.343
18.75%
1 gen 1966 anni
8.682
+0.175
2.06%
1 gen 1967 anni
10.049
+1.367
15.74%
1 gen 1968 anni
13.216
+3.168
31.52%
1 gen 1969 anni
16.705
+3.489
26.4%
1 gen 1970 anni
17.357
+0.651
3.9%
1 gen 1971 anni
12.741
-4.616
-26.59%
1 gen 1972 anni
10.862
-1.879
-14.75%
1 gen 1973 anni
11.544
+0.682
6.28%
1 gen 1974 anni
10.293
-1.252
-10.84%
1 gen 1975 anni
-1.602
-11.894
-115.56%
1 gen 1976 anni
4.437
+6.039
-377.02%
1 gen 1977 anni
10.277
+5.84
131.62%
1 gen 1978 anni
17.706
+7.429
72.28%
1 gen 1979 anni
21.584
+3.878
21.9%
1 gen 1980 anni
20.259
-1.325
-6.14%
1 gen 1981 anni
21.349
+1.09
5.38%
1 gen 1982 anni
30.505
+9.157
42.89%
1 gen 1983 anni
40.118
+9.613
31.51%
1 gen 1984 anni
47.802
+7.685
19.16%
1 gen 1985 anni
47.369
-0.434
-0.91%
1 gen 1986 anni
43.404
-3.965
-8.37%
1 gen 1987 anni
48.672
+5.268
12.14%
1 gen 1988 anni
36.02
-12.652
-25.99%
1 gen 1989 anni
34.305
-1.715
-4.76%
1 gen 1990 anni
20.145
-14.161
-41.28%
1 gen 1991 anni
21.902
+1.757
8.72%
1 gen 1992 anni
21.457
-0.445
-2.03%
1 gen 1993 anni
30.799
+9.342
43.54%
1 gen 1994 anni
39.24
+8.441
27.41%
1 gen 1995 anni
46.44
+7.2
18.35%
1 gen 1996 anni
23.617
-22.823
-49.14%
1 gen 1997 anni
13.257
-10.36
-43.86%
1 gen 1998 anni
12.587
-0.67
-5.05%
1 gen 1999 anni
18.197
+5.609
44.56%
1 gen 2000 anni
19.081
+0.884
4.86%
1 gen 2001 anni
10.006
-9.075
-47.56%
1 gen 2002 anni
19.301
+9.296
92.9%
1 gen 2003 anni
19.549
+0.248
1.28%
1 gen 2004 anni
21.197
+1.648
8.43%
1 gen 2005 anni
11.701
-9.496
-44.8%
1 gen 2006 anni
8.6
-3.101
-26.5%
1 gen 2007 anni
4.909
-3.691
-42.92%
1 gen 2008 anni
19.2
+14.29
291.08%
1 gen 2009 anni
26.554
+7.354
38.3%
1 gen 2010 anni
37.105
+10.551
39.74%
1 gen 2011 anni
18.798
-18.308
-49.34%
1 gen 2012 anni
22.149
+3.352
17.83%
1 gen 2013 anni
20.803
-1.347
-6.08%
1 gen 2014 anni
21.852
+1.05
5.05%
1 gen 2015 anni
21.798
-0.055
-0.25%
1 gen 2016 anni
23.066
+1.269
5.82%
Classificazione dei paesi secondo i statistiche attuali per anni


Commenti: