29
/it/
it
AIzaSyAYiBZKx7MnpbEhh9jyipgxe19OcubqV5w
April 1, 2024
160347
Israel
ISR
true
2
1
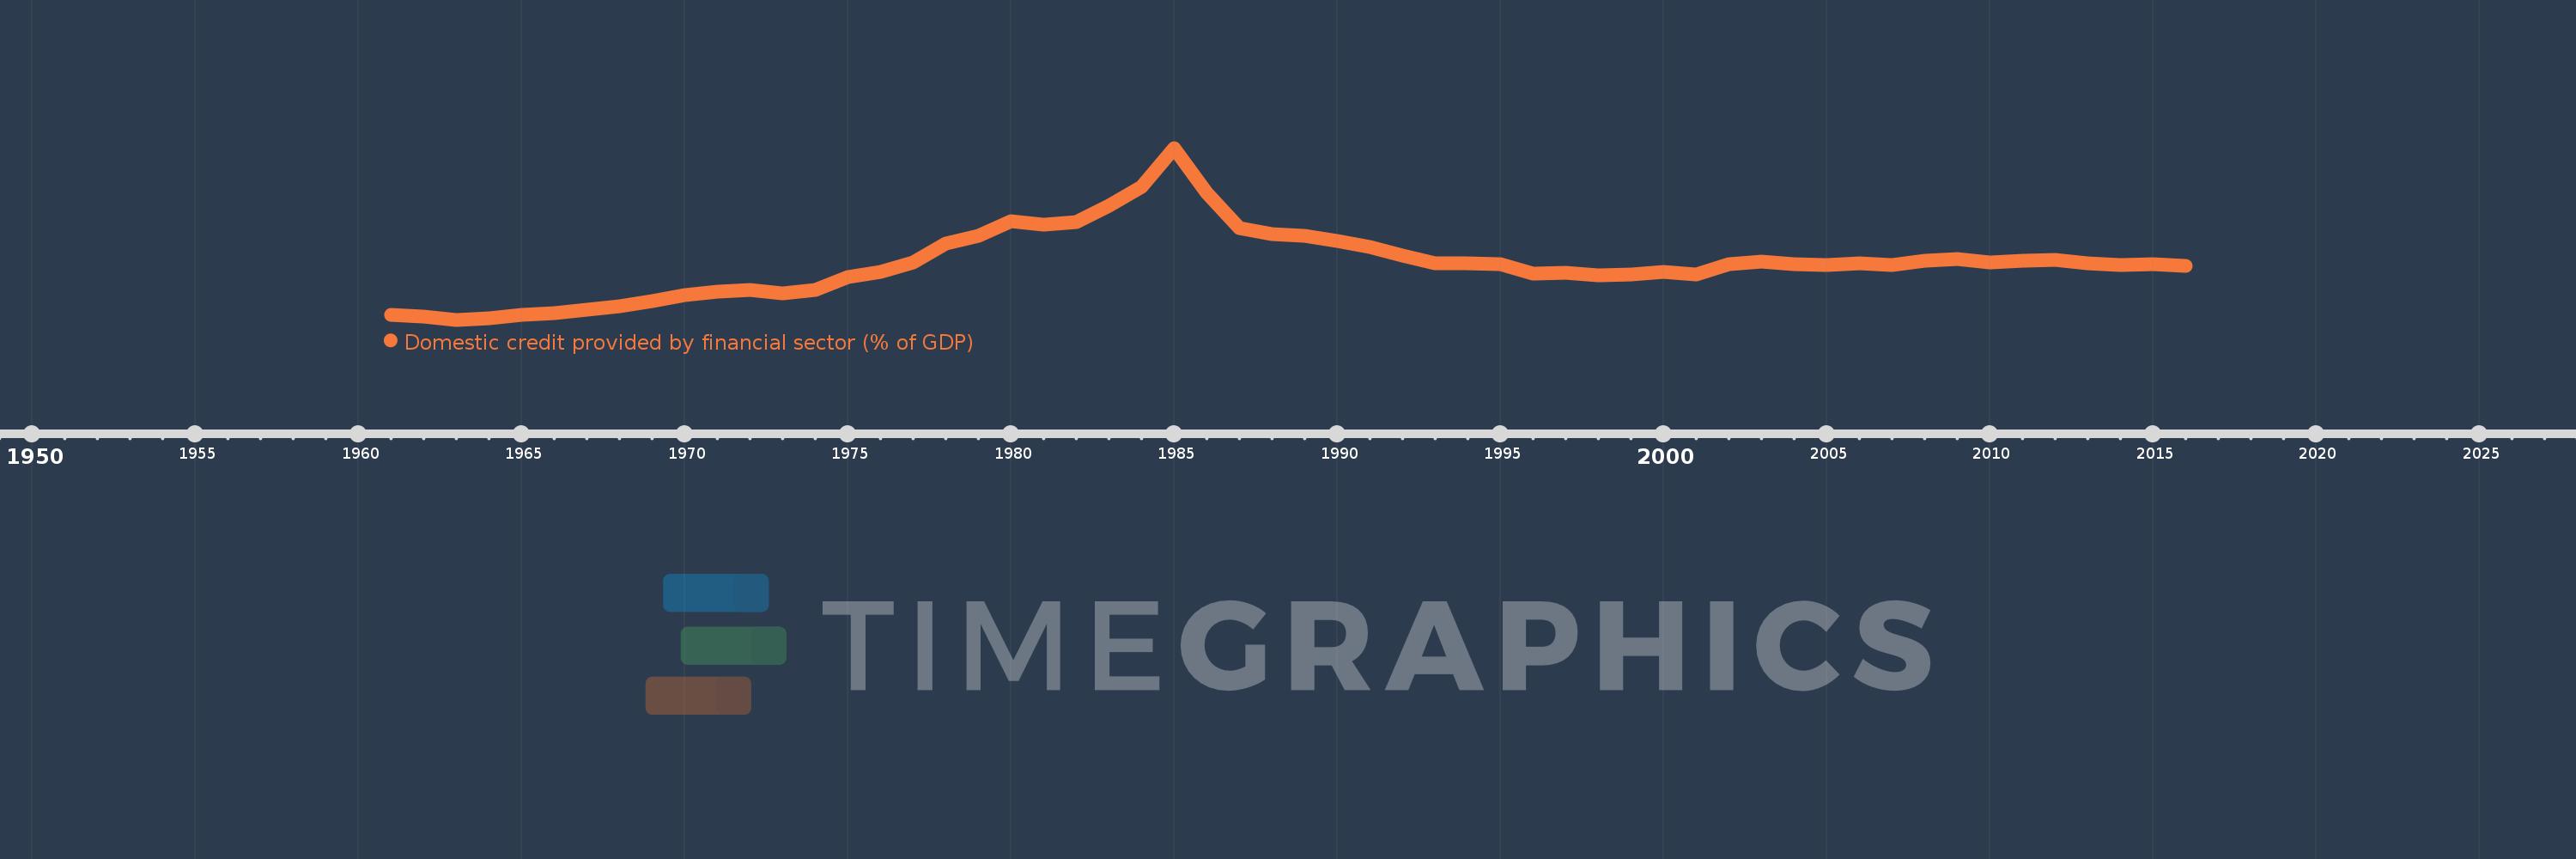
Domestic credit provided by financial sector (% of GDP)
2016,2015,2014,2013,2012,2011,2010,2009,2008,2007,2006,2005,2004,2003,2002,2001,2000,1999,1998,1997,1996,1995,1994,1993,1992,1991,1990,1989,1988,1987,1986,1985,1984,1983,1982,1981,1980,1979,1978,1977,1976,1975,1974,1973,1972,1971,1970,1969,1968,1967,1966,1965,1964,1963,1962,1961
Queste statistiche in altri paesi:
AfghanistanAlbaniaAlgeriaAngolaAntigua and BarbudaArab WorldArgentinaArmeniaArubaAustraliaAustriaAzerbaijanBahamas, TheBahrainBangladeshBarbadosBelarusBelgiumBelizeBeninBhutanBoliviaBosnia and HerzegovinaBotswanaBrazilBrunei DarussalamBulgariaBurkina FasoBurundiCabo VerdeCambodiaCameroonCanadaCaribbean small statesCentral African RepublicCentral Europe and the BalticsChadChileChinaColombiaComorosCongo, Dem. Rep.Congo, Rep.Costa RicaCote d'IvoireCroatiaCyprusCzech RepublicDenmarkDjiboutiDominicaDominican RepublicEarly-demographic dividendEast Asia & PacificEast Asia & Pacific (excluding high income)East Asia & Pacific (IDA & IBRD countries)EcuadorEgypt, Arab Rep.El SalvadorEquatorial GuineaEritreaEstoniaEthiopiaEuro areaEurope & Central AsiaEurope & Central Asia (excluding high income)Europe & Central Asia (IDA & IBRD countries)European UnionFijiFinlandFragile and conflict affected situationsFranceGabonGambia, TheGeorgiaGermanyGhanaGreeceGrenadaGuatemalaGuineaGuinea-BissauGuyanaHaitiHeavily indebted poor countries (HIPC)High incomeHondurasHong Kong SAR, ChinaHungaryIBRD onlyIcelandIDA & IBRD totalIDA blendIDA onlyIDA totalIndiaIndonesiaIran, Islamic Rep.IraqIrelandIsraelItalyJamaicaJapanJordanKazakhstanKenyaKorea, Rep.KosovoKuwaitKyrgyz RepublicLao PDRLate-demographic dividendLatin America & Caribbean Latin America & Caribbean (excluding high income)Latin America & the Caribbean (IDA & IBRD countries)LatviaLeast developed countries: UN classificationLebanonLesothoLiberiaLibyaLithuaniaLow & middle incomeLow incomeLower middle incomeLuxembourgMacao SAR, ChinaMacedonia, FYRMadagascarMalawiMalaysiaMaldivesMaliMaltaMauritaniaMauritiusMexicoMicronesia, Fed. Sts.Middle East & North AfricaMiddle East & North Africa (excluding high income)Middle East & North Africa (IDA & IBRD countries)Middle incomeMoldovaMongoliaMontenegroMoroccoMozambiqueMyanmarNamibiaNepalNetherlandsNew ZealandNicaraguaNigerNigeriaNorth AmericaNorwayOECD membersOmanOther small statesPacific island small statesPakistanPanamaPapua New GuineaParaguayPeruPhilippinesPolandPortugalPost-demographic dividendPre-demographic dividendQatarRomaniaRussian FederationRwandaSamoaSao Tome and PrincipeSaudi ArabiaSenegalSerbiaSeychellesSierra LeoneSingaporeSlovak RepublicSloveniaSmall statesSolomon IslandsSouth AfricaSouth AsiaSouth Asia (IDA & IBRD)South SudanSpainSri LankaSt. Kitts and NevisSt. LuciaSt. Vincent and the GrenadinesSub-Saharan Africa Sub-Saharan Africa (excluding high income)Sub-Saharan Africa (IDA & IBRD countries)SudanSurinameSwazilandSwedenSwitzerlandSyrian Arab RepublicTajikistanTanzaniaThailandTimor-LesteTogoTongaTrinidad and TobagoTunisiaTurkeyUgandaUkraineUnited Arab EmiratesUnited KingdomUnited StatesUpper middle incomeUruguayVanuatuVenezuela, RBVietnamWest Bank and GazaWorldYemen, Rep.ZambiaZimbabwe Linea del tempo:
Questa scala temporale mostra un grafico dal 1961 anno al 2016 anno. Israel. I dati fino ad 1960 anno non disponibili. Il numero di osservazioni attuali secondo i date: 56.
La fonte (nome):
Indicatori dello sviluppo mondiale
La fonte (organizzazione):
International Monetary Fund, International Financial Statistics and data files, and World Bank and OECD GDP estimates.
Categorie:
Financial Sector
sono stati aggiornati
23 apr 2017 anni
Indicatori delle variazioni dei valori per anni
Minima:
14.608
1 gen 1963 anni
Massimo:
232.08
1 gen 1985 anni
Alla data di osservazione
Valore
Variazione assoluta
La variazione rispetto al valore precedente
1 gen 1961 anni
21.166
+21.166
0.0%
1 gen 1962 anni
19.117
-2.049
-9.68%
1 gen 1963 anni
14.608
-4.509
-23.59%
1 gen 1964 anni
16.709
+2.101
14.38%
1 gen 1965 anni
20.654
+3.945
23.61%
1 gen 1966 anni
22.748
+2.094
10.14%
1 gen 1967 anni
27.136
+4.388
19.29%
1 gen 1968 anni
31.762
+4.626
17.05%
1 gen 1969 anni
38.176
+6.414
20.19%
1 gen 1970 anni
46.347
+8.172
21.41%
1 gen 1971 anni
50.524
+4.177
9.01%
1 gen 1972 anni
51.908
+1.384
2.74%
1 gen 1973 anni
47.83
-4.078
-7.86%
1 gen 1974 anni
52.546
+4.716
9.86%
1 gen 1975 anni
68.985
+16.439
31.29%
1 gen 1976 anni
75.412
+6.427
9.32%
1 gen 1977 anni
86.637
+11.225
14.88%
1 gen 1978 anni
110.541
+23.903
27.59%
1 gen 1979 anni
120.867
+10.326
9.34%
1 gen 1980 anni
139.723
+18.856
15.6%
1 gen 1981 anni
135.166
-4.557
-3.26%
1 gen 1982 anni
138.29
+3.124
2.31%
1 gen 1983 anni
158.787
+20.496
14.82%
1 gen 1984 anni
183.301
+24.515
15.44%
1 gen 1985 anni
232.08
+48.779
26.61%
1 gen 1986 anni
175.191
-56.889
-24.51%
1 gen 1987 anni
130.845
-44.346
-25.31%
1 gen 1988 anni
123.252
-7.593
-5.8%
1 gen 1989 anni
121.383
-1.87
-1.52%
1 gen 1990 anni
114.178
-7.205
-5.94%
1 gen 1991 anni
106.229
-7.948
-6.96%
1 gen 1992 anni
96.083
-10.146
-9.55%
1 gen 1993 anni
86.414
-9.668
-10.06%
1 gen 1994 anni
86.532
+0.118
0.14%
1 gen 1995 anni
84.453
-2.079
-2.4%
1 gen 1996 anni
73.045
-11.408
-13.51%
1 gen 1997 anni
73.947
+0.902
1.24%
1 gen 1998 anni
70.492
-3.455
-4.67%
1 gen 1999 anni
71.749
+1.256
1.78%
1 gen 2000 anni
75.273
+3.524
4.91%
1 gen 2001 anni
72.15
-3.122
-4.15%
1 gen 2002 anni
85.26
+13.11
18.17%
1 gen 2003 anni
87.737
+2.476
2.9%
1 gen 2004 anni
84.971
-2.766
-3.15%
1 gen 2005 anni
83.716
-1.256
-1.48%
1 gen 2006 anni
86.338
+2.622
3.13%
1 gen 2007 anni
83.505
-2.832
-3.28%
1 gen 2008 anni
88.779
+5.273
6.32%
1 gen 2009 anni
91.746
+2.967
3.34%
1 gen 2010 anni
87.443
-4.303
-4.69%
1 gen 2011 anni
88.863
+1.42
1.62%
1 gen 2012 anni
89.964
+1.1
1.24%
1 gen 2013 anni
85.853
-4.11
-4.57%
1 gen 2014 anni
84.036
-1.817
-2.12%
1 gen 2015 anni
84.76
+0.723
0.86%
1 gen 2016 anni
82.252
-2.508
-2.96%
Classificazione dei paesi secondo i statistiche attuali per anni


Commenti: