29
/it/
it
AIzaSyAYiBZKx7MnpbEhh9jyipgxe19OcubqV5w
April 1, 2024
76043
Bahamas, The
BHS
true
2
1
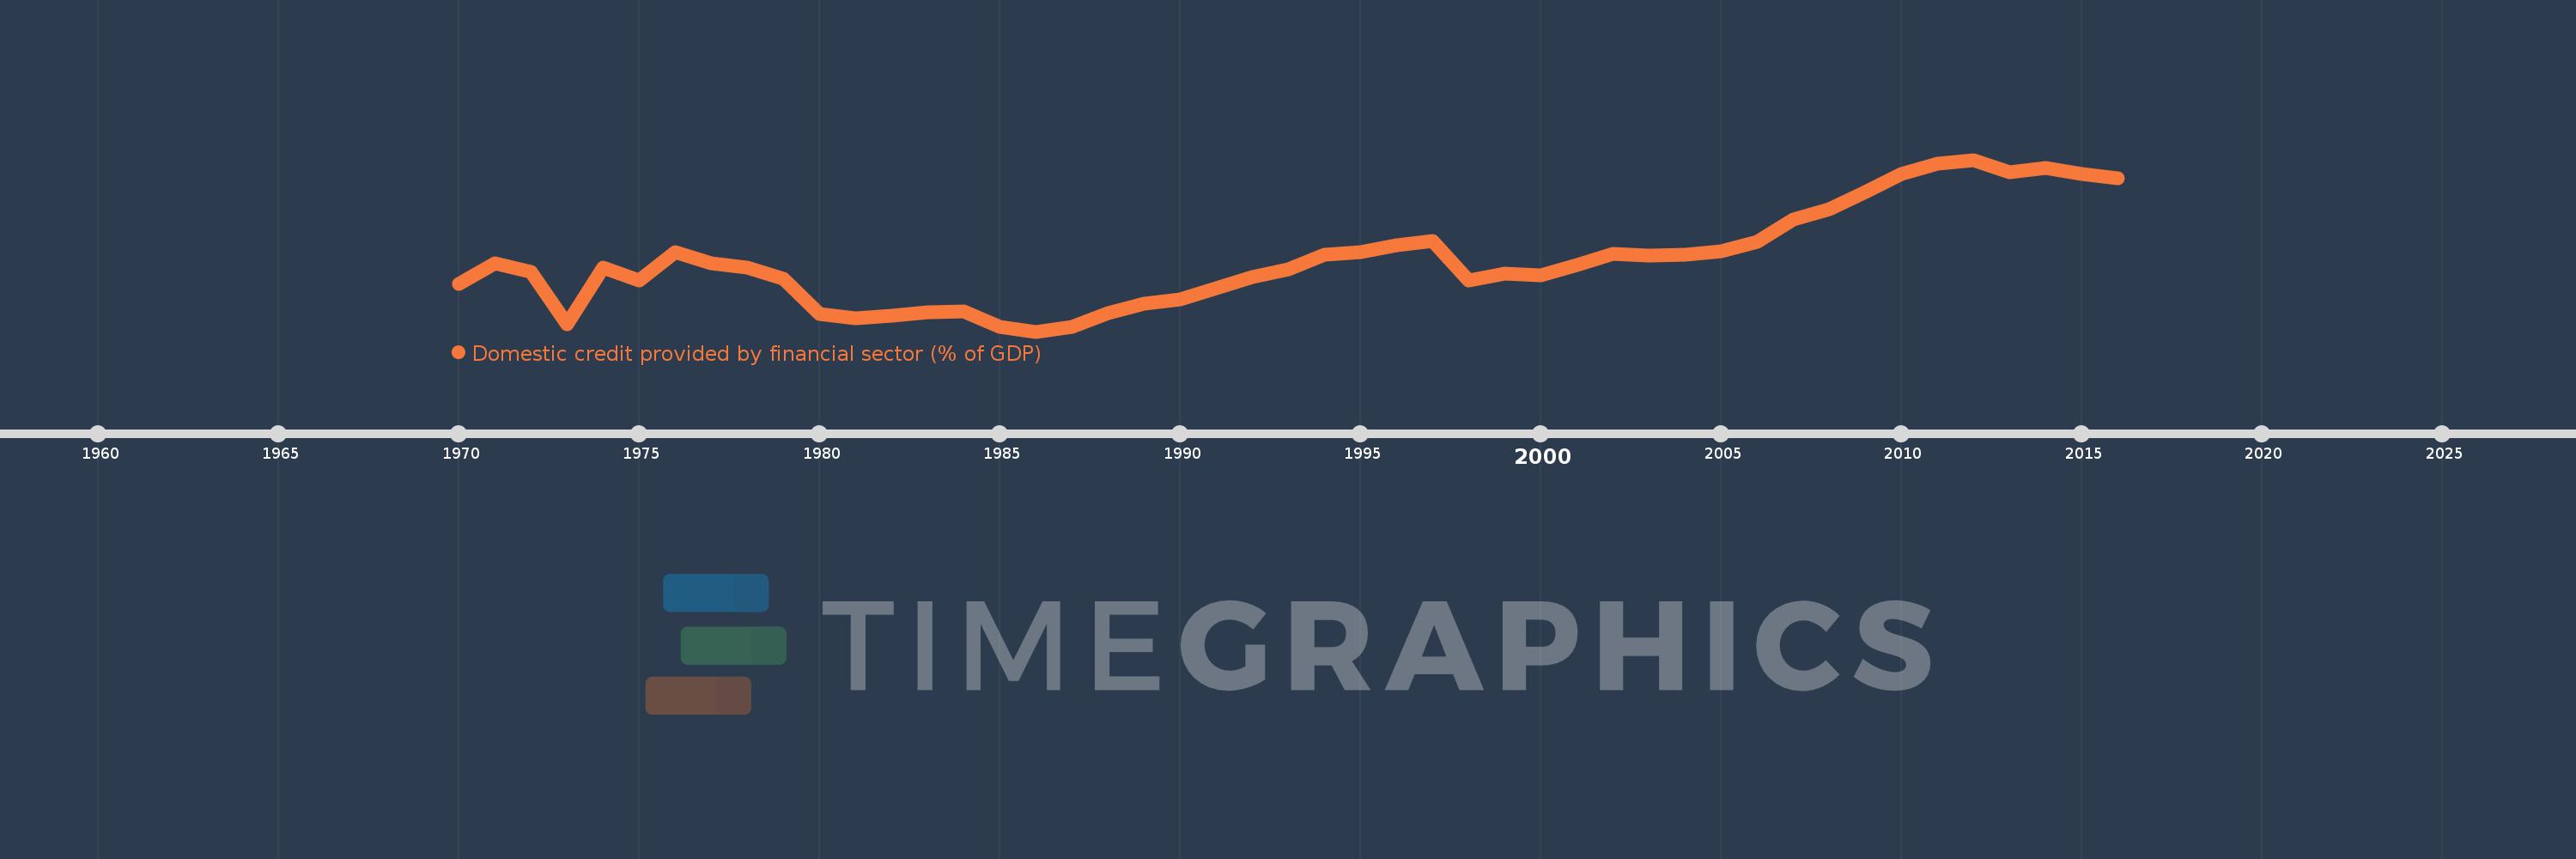
Domestic credit provided by financial sector (% of GDP)
2016,2015,2014,2013,2012,2011,2010,2009,2008,2007,2006,2005,2004,2003,2002,2001,2000,1999,1998,1997,1996,1995,1994,1993,1992,1991,1990,1989,1988,1987,1986,1985,1984,1983,1982,1981,1980,1979,1978,1977,1976,1975,1974,1973,1972,1971,1970
Queste statistiche in altri paesi:
AfghanistanAlbaniaAlgeriaAngolaAntigua and BarbudaArab WorldArgentinaArmeniaArubaAustraliaAustriaAzerbaijanBahamas, TheBahrainBangladeshBarbadosBelarusBelgiumBelizeBeninBhutanBoliviaBosnia and HerzegovinaBotswanaBrazilBrunei DarussalamBulgariaBurkina FasoBurundiCabo VerdeCambodiaCameroonCanadaCaribbean small statesCentral African RepublicCentral Europe and the BalticsChadChileChinaColombiaComorosCongo, Dem. Rep.Congo, Rep.Costa RicaCote d'IvoireCroatiaCyprusCzech RepublicDenmarkDjiboutiDominicaDominican RepublicEarly-demographic dividendEast Asia & PacificEast Asia & Pacific (excluding high income)East Asia & Pacific (IDA & IBRD countries)EcuadorEgypt, Arab Rep.El SalvadorEquatorial GuineaEritreaEstoniaEthiopiaEuro areaEurope & Central AsiaEurope & Central Asia (excluding high income)Europe & Central Asia (IDA & IBRD countries)European UnionFijiFinlandFragile and conflict affected situationsFranceGabonGambia, TheGeorgiaGermanyGhanaGreeceGrenadaGuatemalaGuineaGuinea-BissauGuyanaHaitiHeavily indebted poor countries (HIPC)High incomeHondurasHong Kong SAR, ChinaHungaryIBRD onlyIcelandIDA & IBRD totalIDA blendIDA onlyIDA totalIndiaIndonesiaIran, Islamic Rep.IraqIrelandIsraelItalyJamaicaJapanJordanKazakhstanKenyaKorea, Rep.KosovoKuwaitKyrgyz RepublicLao PDRLate-demographic dividendLatin America & Caribbean Latin America & Caribbean (excluding high income)Latin America & the Caribbean (IDA & IBRD countries)LatviaLeast developed countries: UN classificationLebanonLesothoLiberiaLibyaLithuaniaLow & middle incomeLow incomeLower middle incomeLuxembourgMacao SAR, ChinaMacedonia, FYRMadagascarMalawiMalaysiaMaldivesMaliMaltaMauritaniaMauritiusMexicoMicronesia, Fed. Sts.Middle East & North AfricaMiddle East & North Africa (excluding high income)Middle East & North Africa (IDA & IBRD countries)Middle incomeMoldovaMongoliaMontenegroMoroccoMozambiqueMyanmarNamibiaNepalNetherlandsNew ZealandNicaraguaNigerNigeriaNorth AmericaNorwayOECD membersOmanOther small statesPacific island small statesPakistanPanamaPapua New GuineaParaguayPeruPhilippinesPolandPortugalPost-demographic dividendPre-demographic dividendQatarRomaniaRussian FederationRwandaSamoaSao Tome and PrincipeSaudi ArabiaSenegalSerbiaSeychellesSierra LeoneSingaporeSlovak RepublicSloveniaSmall statesSolomon IslandsSouth AfricaSouth AsiaSouth Asia (IDA & IBRD)South SudanSpainSri LankaSt. Kitts and NevisSt. LuciaSt. Vincent and the GrenadinesSub-Saharan Africa Sub-Saharan Africa (excluding high income)Sub-Saharan Africa (IDA & IBRD countries)SudanSurinameSwazilandSwedenSwitzerlandSyrian Arab RepublicTajikistanTanzaniaThailandTimor-LesteTogoTongaTrinidad and TobagoTunisiaTurkeyUgandaUkraineUnited Arab EmiratesUnited KingdomUnited StatesUpper middle incomeUruguayVanuatuVenezuela, RBVietnamWest Bank and GazaWorldYemen, Rep.ZambiaZimbabwe Linea del tempo:
Questa scala temporale mostra un grafico dal 1970 anno al 2016 anno. Bahamas, The. I dati fino ad 1969 anno non disponibili. Il numero di osservazioni attuali secondo i date: 47.
La fonte (nome):
Indicatori dello sviluppo mondiale
La fonte (organizzazione):
International Monetary Fund, International Financial Statistics and data files, and World Bank and OECD GDP estimates.
Categorie:
Financial Sector
sono stati aggiornati
23 apr 2017 anni
Indicatori delle variazioni dei valori per anni
Minima:
42.289
1 gen 1986 anni
Massimo:
106.695
1 gen 2012 anni
Alla data di osservazione
Valore
Variazione assoluta
La variazione rispetto al valore precedente
1 gen 1970 anni
60.126
+60.126
0.0%
1 gen 1971 anni
68.007
+7.881
13.11%
1 gen 1972 anni
64.754
-3.253
-4.78%
1 gen 1973 anni
44.898
-19.856
-30.66%
1 gen 1974 anni
66.359
+21.461
47.8%
1 gen 1975 anni
61.591
-4.768
-7.18%
1 gen 1976 anni
71.972
+10.382
16.86%
1 gen 1977 anni
67.824
-4.148
-5.76%
1 gen 1978 anni
66.381
-1.443
-2.13%
1 gen 1979 anni
62.158
-4.224
-6.36%
1 gen 1980 anni
48.842
-13.316
-21.42%
1 gen 1981 anni
47.435
-1.407
-2.88%
1 gen 1982 anni
48.23
+0.795
1.68%
1 gen 1983 anni
49.401
+1.171
2.43%
1 gen 1984 anni
49.815
+0.414
0.84%
1 gen 1985 anni
44.035
-5.78
-11.6%
1 gen 1986 anni
42.289
-1.746
-3.97%
1 gen 1987 anni
43.972
+1.683
3.98%
1 gen 1988 anni
49.352
+5.38
12.23%
1 gen 1989 anni
52.905
+3.553
7.2%
1 gen 1990 anni
54.265
+1.361
2.57%
1 gen 1991 anni
58.471
+4.206
7.75%
1 gen 1992 anni
62.623
+4.152
7.1%
1 gen 1993 anni
65.735
+3.112
4.97%
1 gen 1994 anni
70.993
+5.258
8.0%
1 gen 1995 anni
71.991
+0.999
1.41%
1 gen 1996 anni
74.774
+2.783
3.87%
1 gen 1997 anni
76.384
+1.61
2.15%
1 gen 1998 anni
61.537
-14.847
-19.44%
1 gen 1999 anni
63.932
+2.394
3.89%
1 gen 2000 anni
63.276
-0.656
-1.03%
1 gen 2001 anni
67.307
+4.031
6.37%
1 gen 2002 anni
71.56
+4.253
6.32%
1 gen 2003 anni
70.842
-0.718
-1.0%
1 gen 2004 anni
71.06
+0.218
0.31%
1 gen 2005 anni
72.25
+1.19
1.67%
1 gen 2006 anni
75.994
+3.745
5.18%
1 gen 2007 anni
84.154
+8.16
10.74%
1 gen 2008 anni
88.113
+3.958
4.7%
1 gen 2009 anni
94.678
+6.566
7.45%
1 gen 2010 anni
101.298
+6.619
6.99%
1 gen 2011 anni
105.289
+3.991
3.94%
1 gen 2012 anni
106.695
+1.407
1.34%
1 gen 2013 anni
101.908
-4.787
-4.49%
1 gen 2014 anni
103.614
+1.706
1.67%
1 gen 2015 anni
101.365
-2.249
-2.17%
1 gen 2016 anni
99.775
-1.59
-1.57%
Classificazione dei paesi secondo i statistiche attuali per anni


Commenti: