29
/it/
it
AIzaSyAYiBZKx7MnpbEhh9jyipgxe19OcubqV5w
April 1, 2024
144211
Guatemala
GTM
true
2
1
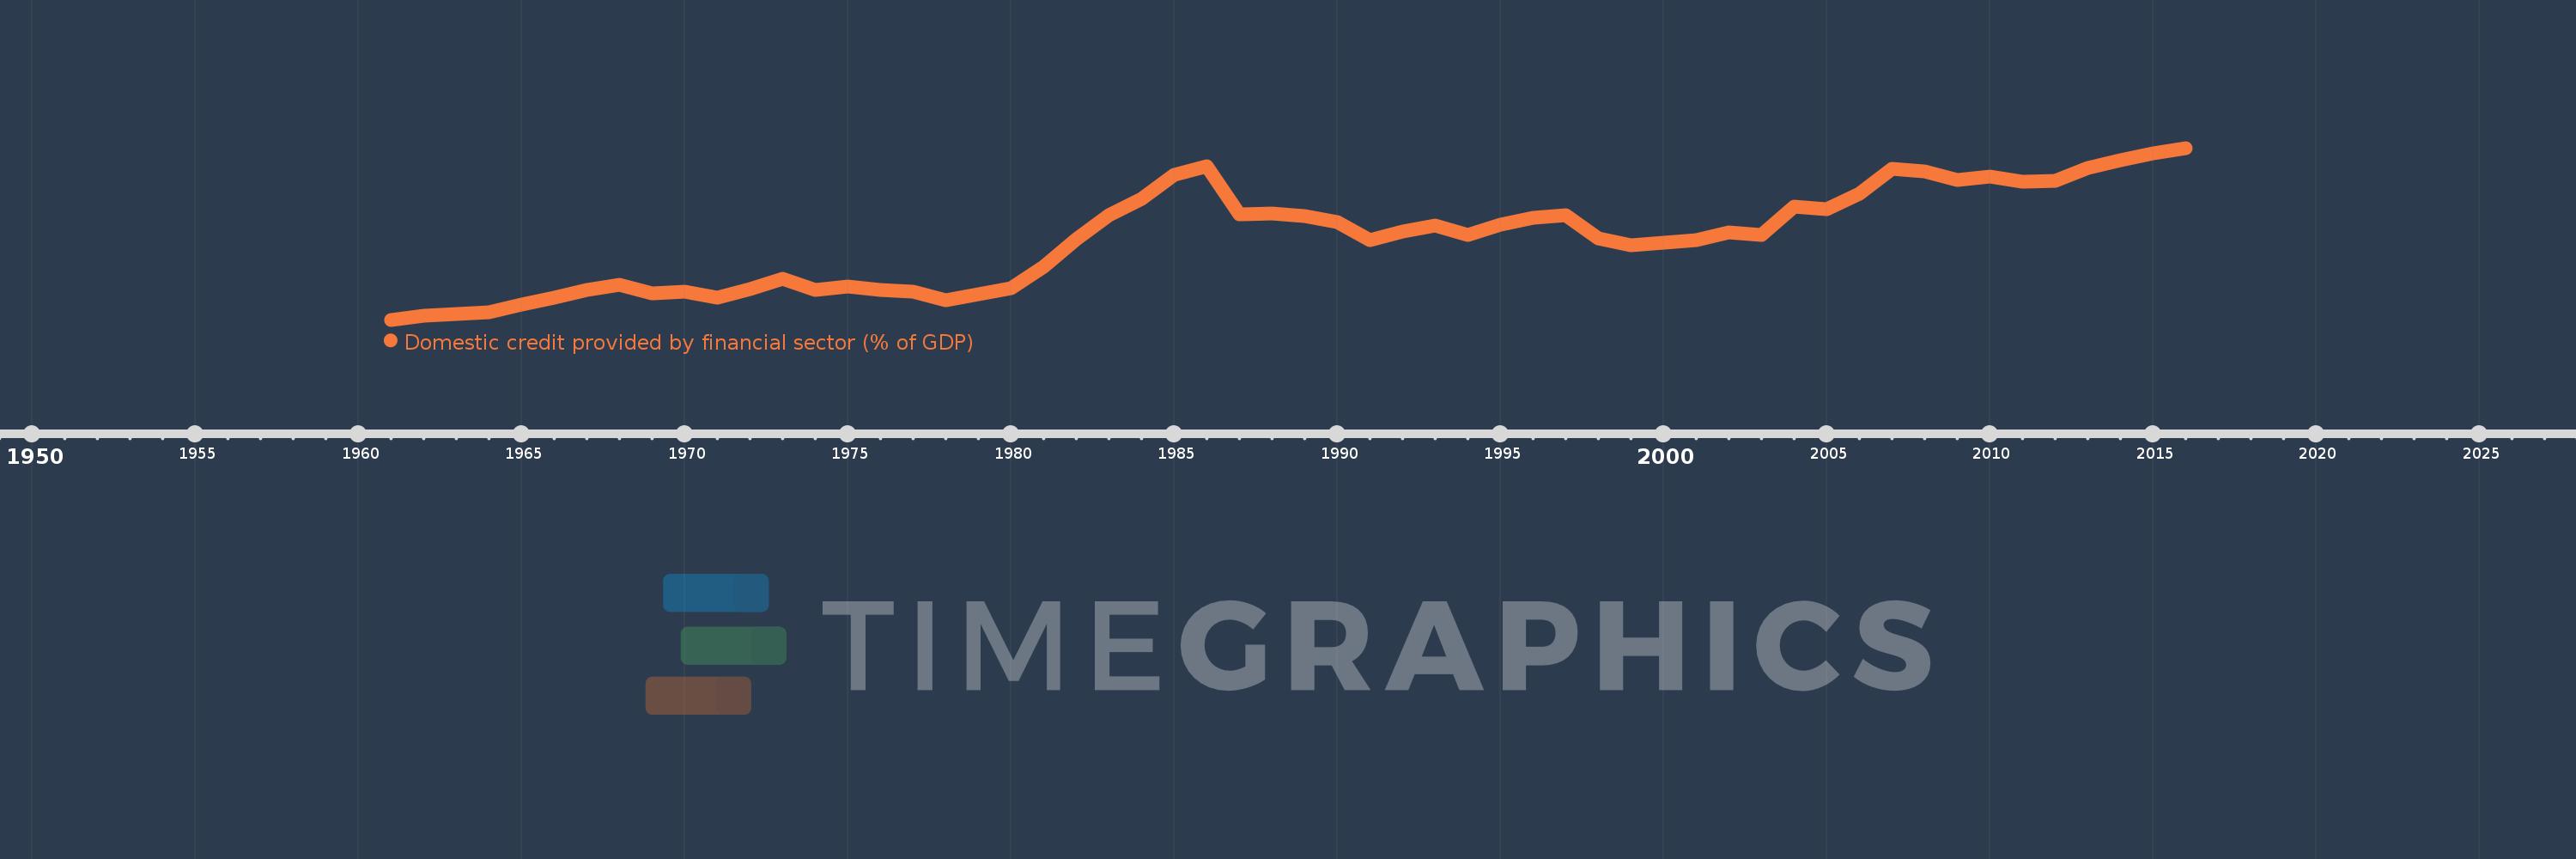
Domestic credit provided by financial sector (% of GDP)
2016,2015,2014,2013,2012,2011,2010,2009,2008,2007,2006,2005,2004,2003,2002,2001,2000,1999,1998,1997,1996,1995,1994,1993,1992,1991,1990,1989,1988,1987,1986,1985,1984,1983,1982,1981,1980,1979,1978,1977,1976,1975,1974,1973,1972,1971,1970,1969,1968,1967,1966,1965,1964,1963,1962,1961
Queste statistiche in altri paesi:
AfghanistanAlbaniaAlgeriaAngolaAntigua and BarbudaArab WorldArgentinaArmeniaArubaAustraliaAustriaAzerbaijanBahamas, TheBahrainBangladeshBarbadosBelarusBelgiumBelizeBeninBhutanBoliviaBosnia and HerzegovinaBotswanaBrazilBrunei DarussalamBulgariaBurkina FasoBurundiCabo VerdeCambodiaCameroonCanadaCaribbean small statesCentral African RepublicCentral Europe and the BalticsChadChileChinaColombiaComorosCongo, Dem. Rep.Congo, Rep.Costa RicaCote d'IvoireCroatiaCyprusCzech RepublicDenmarkDjiboutiDominicaDominican RepublicEarly-demographic dividendEast Asia & PacificEast Asia & Pacific (excluding high income)East Asia & Pacific (IDA & IBRD countries)EcuadorEgypt, Arab Rep.El SalvadorEquatorial GuineaEritreaEstoniaEthiopiaEuro areaEurope & Central AsiaEurope & Central Asia (excluding high income)Europe & Central Asia (IDA & IBRD countries)European UnionFijiFinlandFragile and conflict affected situationsFranceGabonGambia, TheGeorgiaGermanyGhanaGreeceGrenadaGuatemalaGuineaGuinea-BissauGuyanaHaitiHeavily indebted poor countries (HIPC)High incomeHondurasHong Kong SAR, ChinaHungaryIBRD onlyIcelandIDA & IBRD totalIDA blendIDA onlyIDA totalIndiaIndonesiaIran, Islamic Rep.IraqIrelandIsraelItalyJamaicaJapanJordanKazakhstanKenyaKorea, Rep.KosovoKuwaitKyrgyz RepublicLao PDRLate-demographic dividendLatin America & Caribbean Latin America & Caribbean (excluding high income)Latin America & the Caribbean (IDA & IBRD countries)LatviaLeast developed countries: UN classificationLebanonLesothoLiberiaLibyaLithuaniaLow & middle incomeLow incomeLower middle incomeLuxembourgMacao SAR, ChinaMacedonia, FYRMadagascarMalawiMalaysiaMaldivesMaliMaltaMauritaniaMauritiusMexicoMicronesia, Fed. Sts.Middle East & North AfricaMiddle East & North Africa (excluding high income)Middle East & North Africa (IDA & IBRD countries)Middle incomeMoldovaMongoliaMontenegroMoroccoMozambiqueMyanmarNamibiaNepalNetherlandsNew ZealandNicaraguaNigerNigeriaNorth AmericaNorwayOECD membersOmanOther small statesPacific island small statesPakistanPanamaPapua New GuineaParaguayPeruPhilippinesPolandPortugalPost-demographic dividendPre-demographic dividendQatarRomaniaRussian FederationRwandaSamoaSao Tome and PrincipeSaudi ArabiaSenegalSerbiaSeychellesSierra LeoneSingaporeSlovak RepublicSloveniaSmall statesSolomon IslandsSouth AfricaSouth AsiaSouth Asia (IDA & IBRD)South SudanSpainSri LankaSt. Kitts and NevisSt. LuciaSt. Vincent and the GrenadinesSub-Saharan Africa Sub-Saharan Africa (excluding high income)Sub-Saharan Africa (IDA & IBRD countries)SudanSurinameSwazilandSwedenSwitzerlandSyrian Arab RepublicTajikistanTanzaniaThailandTimor-LesteTogoTongaTrinidad and TobagoTunisiaTurkeyUgandaUkraineUnited Arab EmiratesUnited KingdomUnited StatesUpper middle incomeUruguayVanuatuVenezuela, RBVietnamWest Bank and GazaWorldYemen, Rep.ZambiaZimbabwe Linea del tempo:
Questa scala temporale mostra un grafico dal 1961 anno al 2016 anno. Guatemala. I dati fino ad 1960 anno non disponibili. Il numero di osservazioni attuali secondo i date: 56.
La fonte (nome):
Indicatori dello sviluppo mondiale
La fonte (organizzazione):
International Monetary Fund, International Financial Statistics and data files, and World Bank and OECD GDP estimates.
Categorie:
Financial Sector
sono stati aggiornati
23 apr 2017 anni
Indicatori delle variazioni dei valori per anni
Minima:
11.221
1 gen 1961 anni
Massimo:
42.8
1 gen 2016 anni
Alla data di osservazione
Valore
Variazione assoluta
La variazione rispetto al valore precedente
1 gen 1961 anni
11.221
+11.221
0.0%
1 gen 1962 anni
11.962
+0.742
6.61%
1 gen 1963 anni
12.233
+0.271
2.26%
1 gen 1964 anni
12.544
+0.31
2.54%
1 gen 1965 anni
14.087
+1.543
12.3%
1 gen 1966 anni
15.202
+1.115
7.92%
1 gen 1967 anni
16.689
+1.487
9.78%
1 gen 1968 anni
17.654
+0.965
5.78%
1 gen 1969 anni
16.088
-1.566
-8.87%
1 gen 1970 anni
16.334
+0.246
1.53%
1 gen 1971 anni
15.341
-0.993
-6.08%
1 gen 1972 anni
16.803
+1.461
9.53%
1 gen 1973 anni
18.807
+2.005
11.93%
1 gen 1974 anni
16.686
-2.121
-11.28%
1 gen 1975 anni
17.409
+0.723
4.33%
1 gen 1976 anni
16.704
-0.706
-4.05%
1 gen 1977 anni
16.414
-0.29
-1.74%
1 gen 1978 anni
14.871
-1.543
-9.4%
1 gen 1979 anni
15.952
+1.081
7.27%
1 gen 1980 anni
17.053
+1.101
6.9%
1 gen 1981 anni
20.97
+3.917
22.97%
1 gen 1982 anni
26.08
+5.109
24.36%
1 gen 1983 anni
30.371
+4.291
16.45%
1 gen 1984 anni
33.473
+3.102
10.22%
1 gen 1985 anni
37.811
+4.338
12.96%
1 gen 1986 anni
39.391
+1.58
4.18%
1 gen 1987 anni
30.612
-8.779
-22.29%
1 gen 1988 anni
30.72
+0.108
0.35%
1 gen 1989 anni
30.212
-0.508
-1.65%
1 gen 1990 anni
29.146
-1.066
-3.53%
1 gen 1991 anni
25.908
-3.238
-11.11%
1 gen 1992 anni
27.515
+1.607
6.2%
1 gen 1993 anni
28.521
+1.007
3.66%
1 gen 1994 anni
26.873
-1.648
-5.78%
1 gen 1995 anni
28.659
+1.786
6.64%
1 gen 1996 anni
30.032
+1.373
4.79%
1 gen 1997 anni
30.387
+0.355
1.18%
1 gen 1998 anni
26.173
-4.214
-13.87%
1 gen 1999 anni
24.833
-1.34
-5.12%
1 gen 2000 anni
25.317
+0.484
1.95%
1 gen 2001 anni
25.882
+0.565
2.23%
1 gen 2002 anni
27.282
+1.4
5.41%
1 gen 2003 anni
26.789
-0.493
-1.81%
1 gen 2004 anni
31.943
+5.154
19.24%
1 gen 2005 anni
31.572
-0.371
-1.16%
1 gen 2006 anni
34.427
+2.855
9.04%
1 gen 2007 anni
38.963
+4.537
13.18%
1 gen 2008 anni
38.552
-0.412
-1.06%
1 gen 2009 anni
36.901
-1.651
-4.28%
1 gen 2010 anni
37.499
+0.598
1.62%
1 gen 2011 anni
36.546
-0.953
-2.54%
1 gen 2012 anni
36.767
+0.22
0.6%
1 gen 2013 anni
39.06
+2.294
6.24%
1 gen 2014 anni
40.591
+1.531
3.92%
1 gen 2015 anni
41.769
+1.178
2.9%
1 gen 2016 anni
42.8
+1.031
2.47%
Classificazione dei paesi secondo i statistiche attuali per anni


Commenti: