29
/it/
it
AIzaSyAYiBZKx7MnpbEhh9jyipgxe19OcubqV5w
April 1, 2024
54017
Pacific island small states
PSS
false
2
1
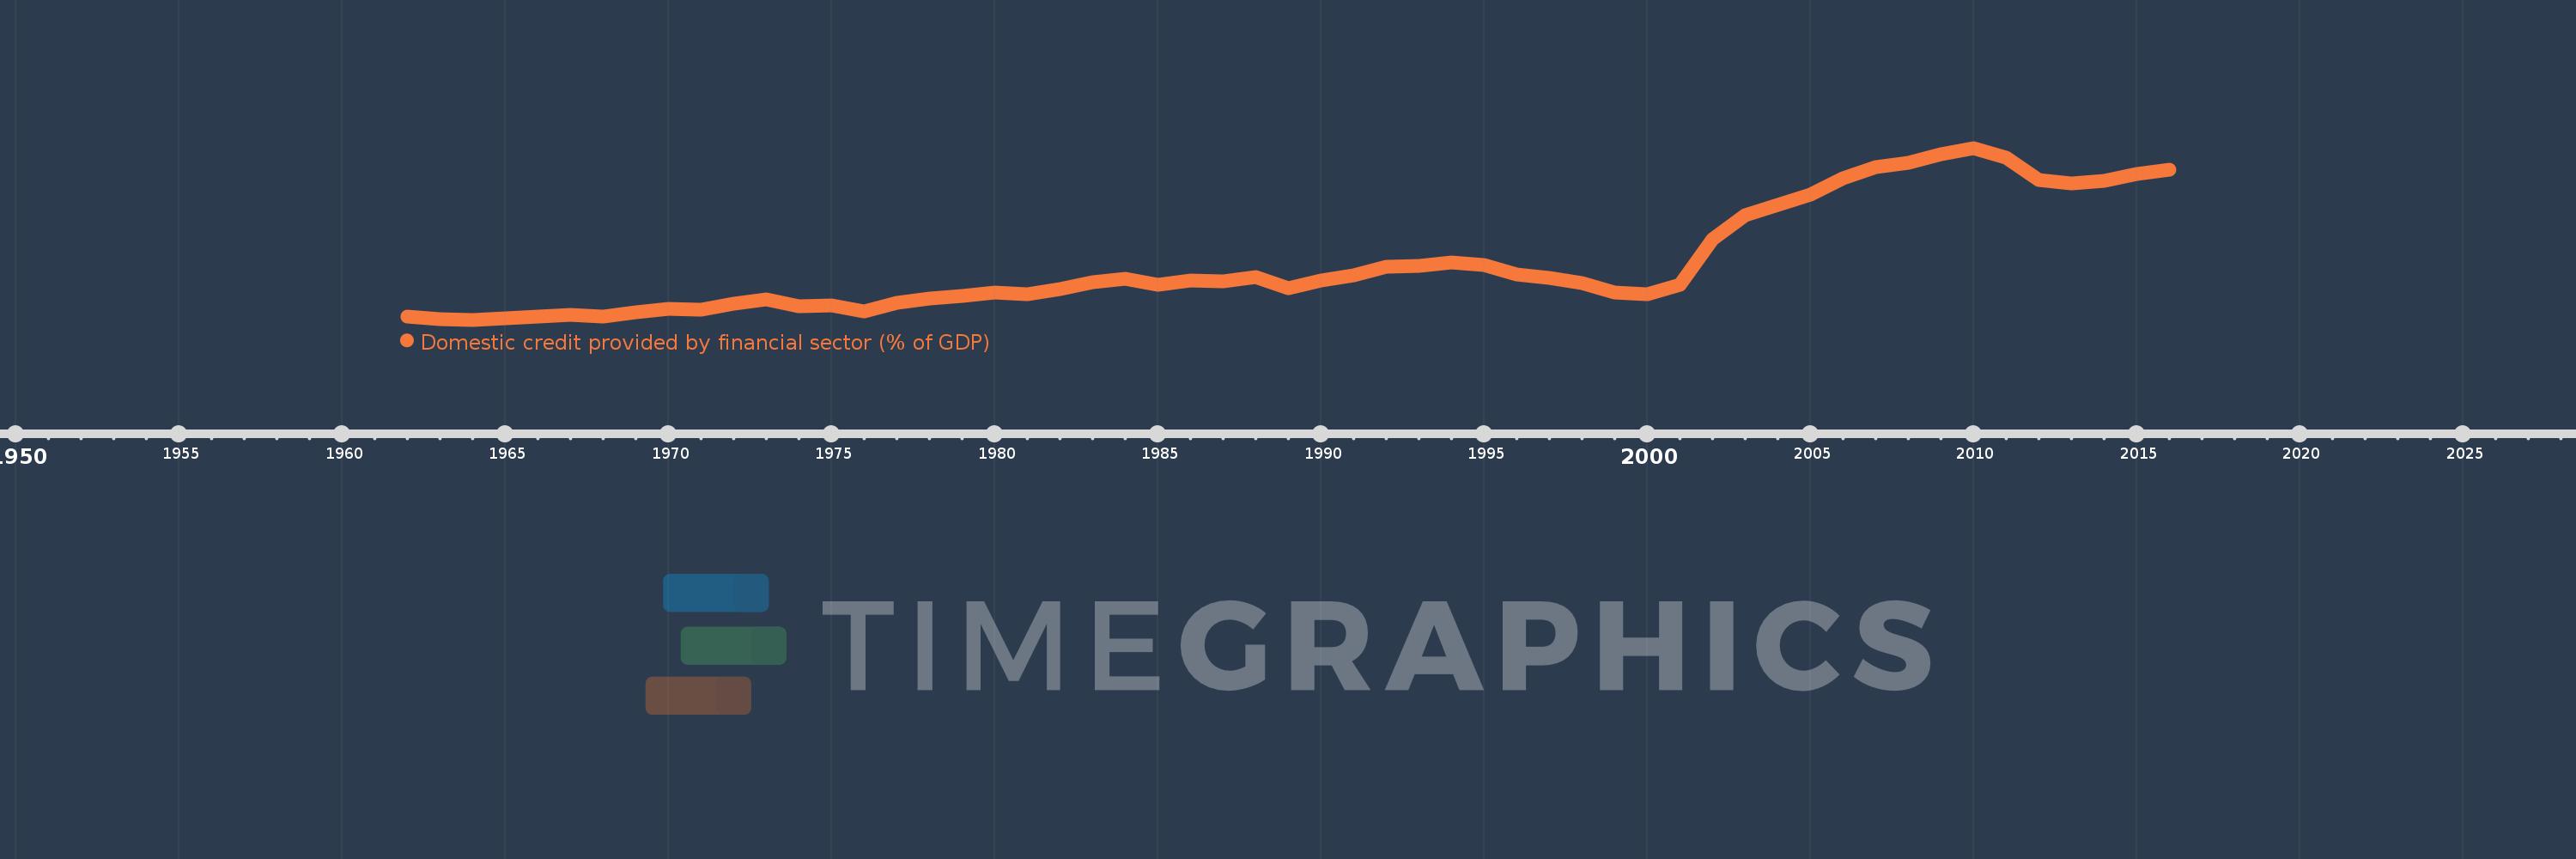
Domestic credit provided by financial sector (% of GDP)
2016,2015,2014,2013,2012,2011,2010,2009,2008,2007,2006,2005,2004,2003,2002,2001,2000,1999,1998,1997,1996,1995,1994,1993,1992,1991,1990,1989,1988,1987,1986,1985,1984,1983,1982,1981,1980,1979,1978,1977,1976,1975,1974,1973,1972,1971,1970,1969,1968,1967,1966,1965,1964,1963,1962
Queste statistiche in altri paesi:
AfghanistanAlbaniaAlgeriaAngolaAntigua and BarbudaArab WorldArgentinaArmeniaArubaAustraliaAustriaAzerbaijanBahamas, TheBahrainBangladeshBarbadosBelarusBelgiumBelizeBeninBhutanBoliviaBosnia and HerzegovinaBotswanaBrazilBrunei DarussalamBulgariaBurkina FasoBurundiCabo VerdeCambodiaCameroonCanadaCaribbean small statesCentral African RepublicCentral Europe and the BalticsChadChileChinaColombiaComorosCongo, Dem. Rep.Congo, Rep.Costa RicaCote d'IvoireCroatiaCyprusCzech RepublicDenmarkDjiboutiDominicaDominican RepublicEarly-demographic dividendEast Asia & PacificEast Asia & Pacific (excluding high income)East Asia & Pacific (IDA & IBRD countries)EcuadorEgypt, Arab Rep.El SalvadorEquatorial GuineaEritreaEstoniaEthiopiaEuro areaEurope & Central AsiaEurope & Central Asia (excluding high income)Europe & Central Asia (IDA & IBRD countries)European UnionFijiFinlandFragile and conflict affected situationsFranceGabonGambia, TheGeorgiaGermanyGhanaGreeceGrenadaGuatemalaGuineaGuinea-BissauGuyanaHaitiHeavily indebted poor countries (HIPC)High incomeHondurasHong Kong SAR, ChinaHungaryIBRD onlyIcelandIDA & IBRD totalIDA blendIDA onlyIDA totalIndiaIndonesiaIran, Islamic Rep.IraqIrelandIsraelItalyJamaicaJapanJordanKazakhstanKenyaKorea, Rep.KosovoKuwaitKyrgyz RepublicLao PDRLate-demographic dividendLatin America & Caribbean Latin America & Caribbean (excluding high income)Latin America & the Caribbean (IDA & IBRD countries)LatviaLeast developed countries: UN classificationLebanonLesothoLiberiaLibyaLithuaniaLow & middle incomeLow incomeLower middle incomeLuxembourgMacao SAR, ChinaMacedonia, FYRMadagascarMalawiMalaysiaMaldivesMaliMaltaMauritaniaMauritiusMexicoMicronesia, Fed. Sts.Middle East & North AfricaMiddle East & North Africa (excluding high income)Middle East & North Africa (IDA & IBRD countries)Middle incomeMoldovaMongoliaMontenegroMoroccoMozambiqueMyanmarNamibiaNepalNetherlandsNew ZealandNicaraguaNigerNigeriaNorth AmericaNorwayOECD membersOmanOther small statesPacific island small statesPakistanPanamaPapua New GuineaParaguayPeruPhilippinesPolandPortugalPost-demographic dividendPre-demographic dividendQatarRomaniaRussian FederationRwandaSamoaSao Tome and PrincipeSaudi ArabiaSenegalSerbiaSeychellesSierra LeoneSingaporeSlovak RepublicSloveniaSmall statesSolomon IslandsSouth AfricaSouth AsiaSouth Asia (IDA & IBRD)South SudanSpainSri LankaSt. Kitts and NevisSt. LuciaSt. Vincent and the GrenadinesSub-Saharan Africa Sub-Saharan Africa (excluding high income)Sub-Saharan Africa (IDA & IBRD countries)SudanSurinameSwazilandSwedenSwitzerlandSyrian Arab RepublicTajikistanTanzaniaThailandTimor-LesteTogoTongaTrinidad and TobagoTunisiaTurkeyUgandaUkraineUnited Arab EmiratesUnited KingdomUnited StatesUpper middle incomeUruguayVanuatuVenezuela, RBVietnamWest Bank and GazaWorldYemen, Rep.ZambiaZimbabwe Linea del tempo:
Questa scala temporale mostra un grafico dal 1962 anno al 2016 anno. Pacific island small states. I dati fino ad 1961 anno non disponibili. Il numero di osservazioni attuali secondo i date: 55.
La fonte (nome):
Indicatori dello sviluppo mondiale
La fonte (organizzazione):
International Monetary Fund, International Financial Statistics and data files, and World Bank and OECD GDP estimates.
Categorie:
Financial Sector
sono stati aggiornati
23 apr 2017 anni
Indicatori delle variazioni dei valori per anni
Minima:
11.177
1 gen 1964 anni
Massimo:
95.763
1 gen 2010 anni
Alla data di osservazione
Valore
Variazione assoluta
La variazione rispetto al valore precedente
1 gen 1962 anni
12.947
+12.947
0.0%
1 gen 1963 anni
11.264
-1.683
-13.0%
1 gen 1964 anni
11.177
-0.087
-0.78%
1 gen 1965 anni
11.749
+0.572
5.12%
1 gen 1966 anni
12.723
+0.974
8.29%
1 gen 1967 anni
13.786
+1.064
8.36%
1 gen 1968 anni
12.745
-1.041
-7.55%
1 gen 1969 anni
14.754
+2.009
15.76%
1 gen 1970 anni
16.72
+1.966
13.32%
1 gen 1971 anni
16.105
-0.615
-3.68%
1 gen 1972 anni
19.08
+2.975
18.47%
1 gen 1973 anni
21.393
+2.312
12.12%
1 gen 1974 anni
17.68
-3.713
-17.36%
1 gen 1975 anni
18.429
+0.749
4.24%
1 gen 1976 anni
15.384
-3.045
-16.52%
1 gen 1977 anni
19.611
+4.227
27.48%
1 gen 1978 anni
21.679
+2.068
10.54%
1 gen 1979 anni
22.764
+1.086
5.01%
1 gen 1980 anni
24.402
+1.638
7.2%
1 gen 1981 anni
23.771
-0.632
-2.59%
1 gen 1982 anni
26.181
+2.41
10.14%
1 gen 1983 anni
29.52
+3.339
12.75%
1 gen 1984 anni
31.167
+1.647
5.58%
1 gen 1985 anni
28.561
-2.606
-8.36%
1 gen 1986 anni
30.485
+1.925
6.74%
1 gen 1987 anni
30.111
-0.375
-1.23%
1 gen 1988 anni
32.073
+1.962
6.52%
1 gen 1989 anni
26.739
-5.334
-16.63%
1 gen 1990 anni
30.601
+3.862
14.44%
1 gen 1991 anni
32.887
+2.286
7.47%
1 gen 1992 anni
37.301
+4.414
13.42%
1 gen 1993 anni
37.761
+0.461
1.24%
1 gen 1994 anni
39.38
+1.619
4.29%
1 gen 1995 anni
37.982
-1.398
-3.55%
1 gen 1996 anni
33.342
-4.64
-12.22%
1 gen 1997 anni
31.952
-1.391
-4.17%
1 gen 1998 anni
29.151
-2.801
-8.76%
1 gen 1999 anni
24.731
-4.42
-15.16%
1 gen 2000 anni
23.903
-0.828
-3.35%
1 gen 2001 anni
28.416
+4.513
18.88%
1 gen 2002 anni
50.777
+22.361
78.69%
1 gen 2003 anni
62.444
+11.667
22.98%
1 gen 2004 anni
67.751
+5.307
8.5%
1 gen 2005 anni
72.855
+5.104
7.53%
1 gen 2006 anni
80.659
+7.804
10.71%
1 gen 2007 anni
86.359
+5.7
7.07%
1 gen 2008 anni
88.309
+1.951
2.26%
1 gen 2009 anni
92.844
+4.535
5.14%
1 gen 2010 anni
95.763
+2.918
3.14%
1 gen 2011 anni
90.974
-4.788
-5.0%
1 gen 2012 anni
80.156
-10.818
-11.89%
1 gen 2013 anni
78.232
-1.924
-2.4%
1 gen 2014 anni
79.378
+1.146
1.46%
1 gen 2015 anni
82.917
+3.539
4.46%
1 gen 2016 anni
85.16
+2.243
2.7%
Classificazione dei paesi secondo i statistiche attuali per anni


Commenti: