29
/it/
it
AIzaSyAYiBZKx7MnpbEhh9jyipgxe19OcubqV5w
April 1, 2024
72872
Australia
AUS
true
2
1
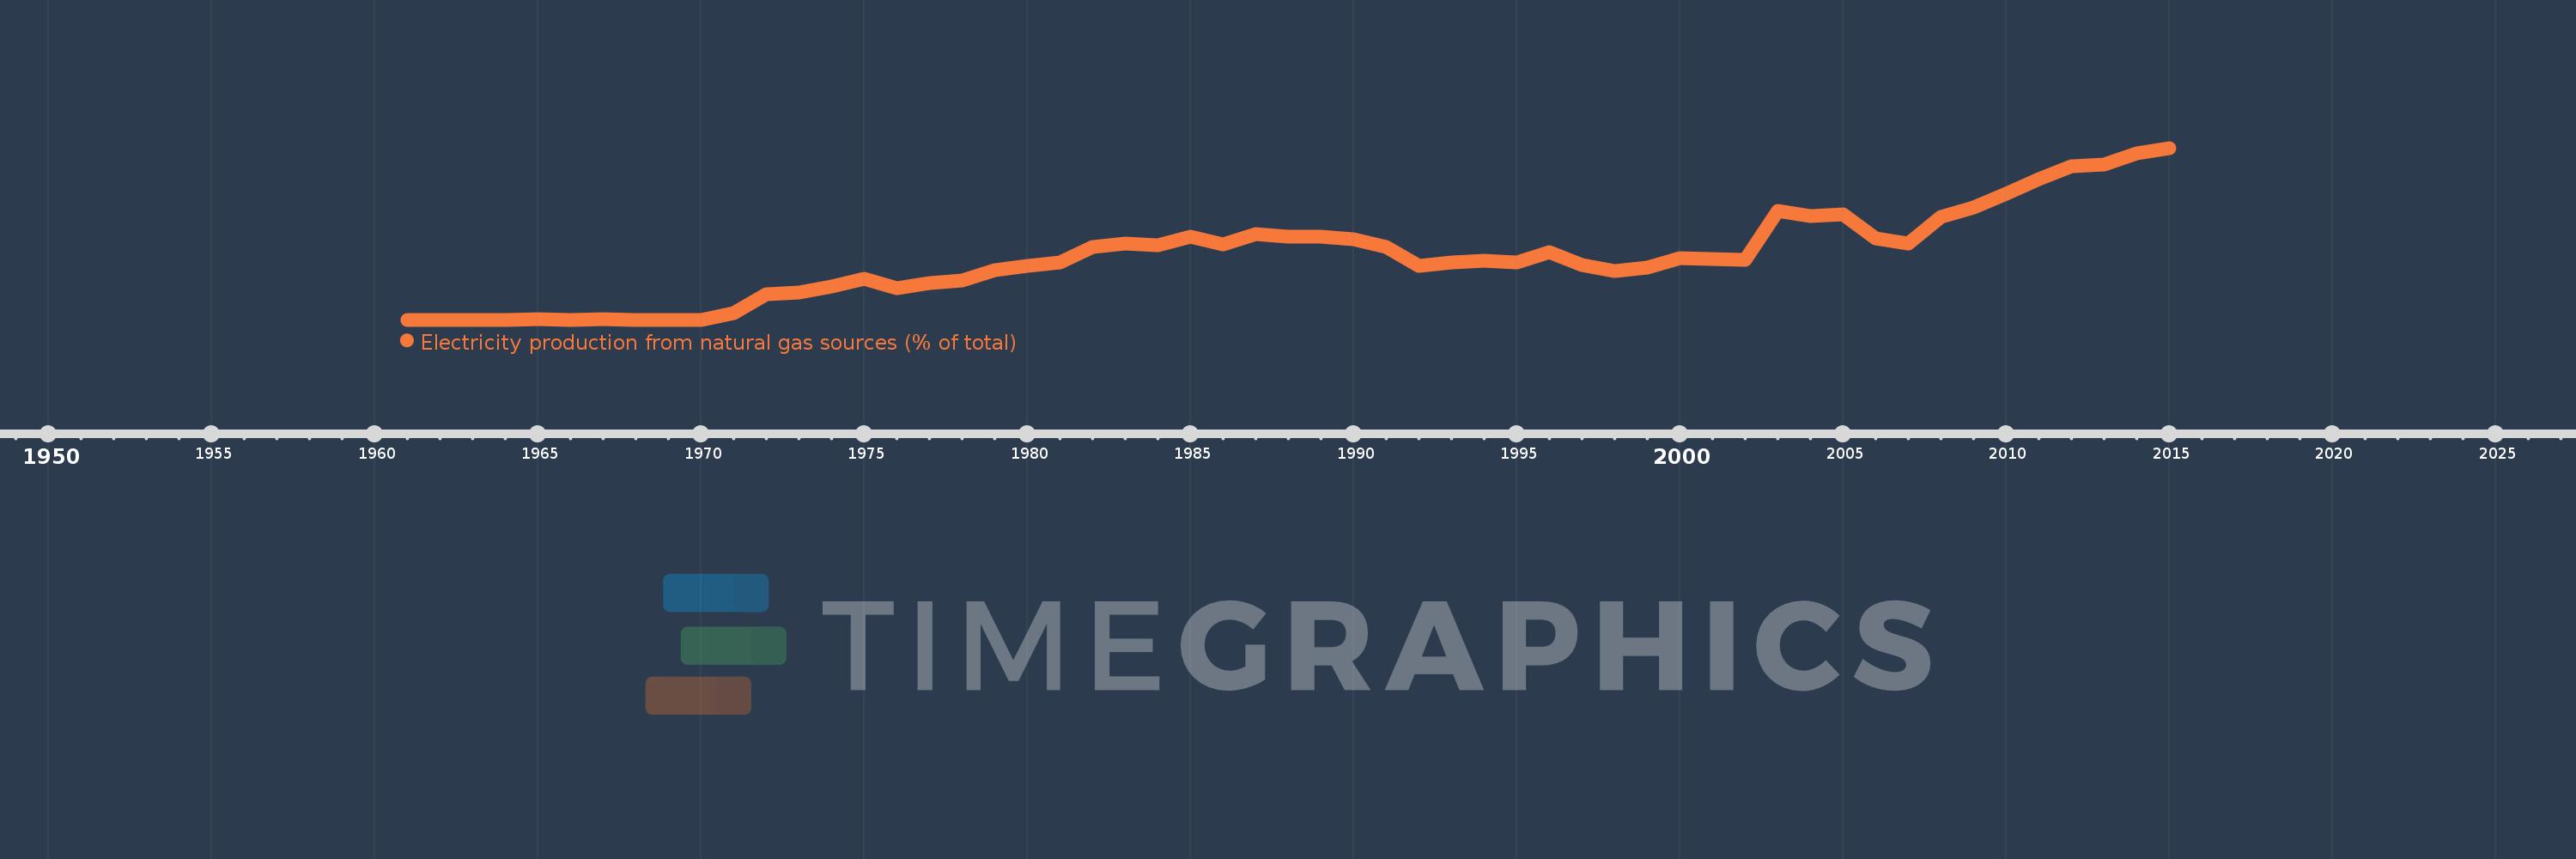
Electricity production from natural gas sources (% of total)
2015,2014,2013,2012,2011,2010,2009,2008,2007,2006,2005,2004,2003,2002,2001,2000,1999,1998,1997,1996,1995,1994,1993,1992,1991,1990,1989,1988,1987,1986,1985,1984,1983,1982,1981,1980,1979,1978,1977,1976,1975,1974,1973,1972,1971,1970,1969,1968,1967,1966,1965,1964,1963,1962,1961
Queste statistiche in altri paesi:
AlbaniaAlgeriaAngolaArab WorldArgentinaArmeniaAustraliaAustriaAzerbaijanBahrainBangladeshBelarusBelgiumBeninBoliviaBosnia and HerzegovinaBotswanaBrazilBrunei DarussalamBulgariaCambodiaCameroonCanadaCentral Europe and the BalticsChileChinaColombiaCongo, Dem. Rep.Congo, Rep.Costa RicaCote d'IvoireCroatiaCubaCuracaoCyprusCzech RepublicDenmarkDominican RepublicEarly-demographic dividendEast Asia & PacificEast Asia & Pacific (excluding high income)East Asia & Pacific (IDA & IBRD countries)EcuadorEgypt, Arab Rep.El SalvadorEritreaEstoniaEthiopiaEuro areaEurope & Central AsiaEurope & Central Asia (excluding high income)Europe & Central Asia (IDA & IBRD countries)European UnionFinlandFragile and conflict affected situationsFranceGabonGeorgiaGermanyGhanaGibraltarGreeceGuatemalaHaitiHeavily indebted poor countries (HIPC)High incomeHondurasHong Kong SAR, ChinaHungaryIBRD onlyIcelandIDA & IBRD totalIDA blendIDA onlyIDA totalIndiaIndonesiaIran, Islamic Rep.IraqIrelandIsraelItalyJamaicaJapanJordanKazakhstanKenyaKorea, Dem. People’s Rep.Korea, Rep.KosovoKuwaitKyrgyz RepublicLate-demographic dividendLatin America & Caribbean Latin America & Caribbean (excluding high income)Latin America & the Caribbean (IDA & IBRD countries)LatviaLeast developed countries: UN classificationLebanonLibyaLithuaniaLow & middle incomeLower middle incomeLuxembourgMacedonia, FYRMalaysiaMaltaMauritiusMexicoMiddle East & North AfricaMiddle East & North Africa (excluding high income)Middle East & North Africa (IDA & IBRD countries)Middle incomeMoldovaMongoliaMontenegroMoroccoMozambiqueMyanmarNamibiaNepalNetherlandsNew ZealandNicaraguaNigerNigeriaNorth AmericaNorwayOECD membersOmanOther small statesPakistanPanamaParaguayPeruPhilippinesPolandPortugalPost-demographic dividendPre-demographic dividendQatarRomaniaRussian FederationSaudi ArabiaSenegalSerbiaSingaporeSlovak RepublicSloveniaSmall statesSouth AfricaSouth AsiaSouth Asia (IDA & IBRD)South SudanSpainSri LankaSub-Saharan Africa Sub-Saharan Africa (excluding high income)Sub-Saharan Africa (IDA & IBRD countries)SudanSwedenSwitzerlandSyrian Arab RepublicTajikistanTanzaniaThailandTogoTrinidad and TobagoTunisiaTurkeyTurkmenistanUkraineUnited Arab EmiratesUnited KingdomUnited StatesUpper middle incomeUruguayUzbekistanVenezuela, RBVietnamWorldYemen, Rep.ZambiaZimbabwe Linea del tempo:
Questa scala temporale mostra un grafico dal 1961 anno al 2015 anno. Australia. I dati fino ad 1960 anno non disponibili. Il numero di osservazioni attuali secondo i date: 55.
La fonte (nome):
Indicatori dello sviluppo mondiale
La fonte (organizzazione):
IEA Statistics © OECD/IEA 2014 (http://www.iea.org/stats/index.asp), subject to https://www.iea.org/t&c/termsandconditions/
Categorie:
Energy & Mining, Climate Change, Infrastructure
sono stati aggiornati
23 apr 2017 anni
Indicatori delle variazioni dei valori per anni
Minima:
0.0
1 gen 1961 anni
Massimo:
21.974
1 gen 2015 anni
Alla data di osservazione
Valore
Variazione assoluta
La variazione rispetto al valore precedente
1 gen 1961 anni
0.0
0.0
0.0%
1 gen 1963 anni
0.012
+0.012
%
1 gen 1964 anni
0.018
+0.006
49.4%
1 gen 1965 anni
0.023
+0.005
26.01%
1 gen 1966 anni
0.021
-0.002
-9.07%
1 gen 1967 anni
0.022
+0.001
6.3%
1 gen 1968 anni
0.021
-0.002
-7.57%
1 gen 1969 anni
0.017
-0.004
-18.45%
1 gen 1970 anni
0.02
+0.003
17.73%
1 gen 1971 anni
0.867
+0.847
4.29 Mille.%
1 gen 1972 anni
3.269
+2.402
277.16%
1 gen 1973 anni
3.481
+0.212
6.5%
1 gen 1974 anni
4.271
+0.79
22.69%
1 gen 1975 anni
5.218
+0.947
22.18%
1 gen 1976 anni
4.001
-1.217
-23.32%
1 gen 1977 anni
4.654
+0.652
16.31%
1 gen 1978 anni
5.002
+0.348
7.49%
1 gen 1979 anni
6.389
+1.387
27.72%
1 gen 1980 anni
6.876
+0.488
7.64%
1 gen 1981 anni
7.325
+0.449
6.53%
1 gen 1982 anni
9.303
+1.977
27.0%
1 gen 1983 anni
9.741
+0.439
4.71%
1 gen 1984 anni
9.473
-0.268
-2.75%
1 gen 1985 anni
10.575
+1.101
11.62%
1 gen 1986 anni
9.611
-0.963
-9.11%
1 gen 1987 anni
10.994
+1.383
14.39%
1 gen 1988 anni
10.636
-0.358
-3.26%
1 gen 1989 anni
10.643
+0.006
0.06%
1 gen 1990 anni
10.285
-0.357
-3.36%
1 gen 1991 anni
9.307
-0.979
-9.52%
1 gen 1992 anni
6.881
-2.425
-26.06%
1 gen 1993 anni
7.311
+0.429
6.24%
1 gen 1994 anni
7.532
+0.221
3.03%
1 gen 1995 anni
7.297
-0.235
-3.12%
1 gen 1996 anni
8.63
+1.333
18.26%
1 gen 1997 anni
7.02
-1.61
-18.65%
1 gen 1998 anni
6.257
-0.763
-10.86%
1 gen 1999 anni
6.632
+0.375
5.99%
1 gen 2000 anni
7.858
+1.226
18.48%
1 gen 2001 anni
7.741
-0.117
-1.49%
1 gen 2002 anni
7.701
-0.04
-0.51%
1 gen 2003 anni
13.955
+6.254
81.2%
1 gen 2004 anni
13.238
-0.717
-5.14%
1 gen 2005 anni
13.469
+0.231
1.74%
1 gen 2006 anni
10.424
-3.045
-22.61%
1 gen 2007 anni
9.765
-0.659
-6.32%
1 gen 2008 anni
13.108
+3.343
34.23%
1 gen 2009 anni
14.38
+1.273
9.71%
1 gen 2010 anni
16.113
+1.733
12.05%
1 gen 2011 anni
17.937
+1.824
11.32%
1 gen 2012 anni
19.608
+1.671
9.32%
1 gen 2013 anni
19.845
+0.236
1.21%
1 gen 2014 anni
21.326
+1.481
7.46%
1 gen 2015 anni
21.974
+0.648
3.04%
Classificazione dei paesi secondo i statistiche attuali per anni


Commenti: