29
/it/
it
AIzaSyAYiBZKx7MnpbEhh9jyipgxe19OcubqV5w
April 1, 2024
216301
Pakistan
PAK
true
2
1
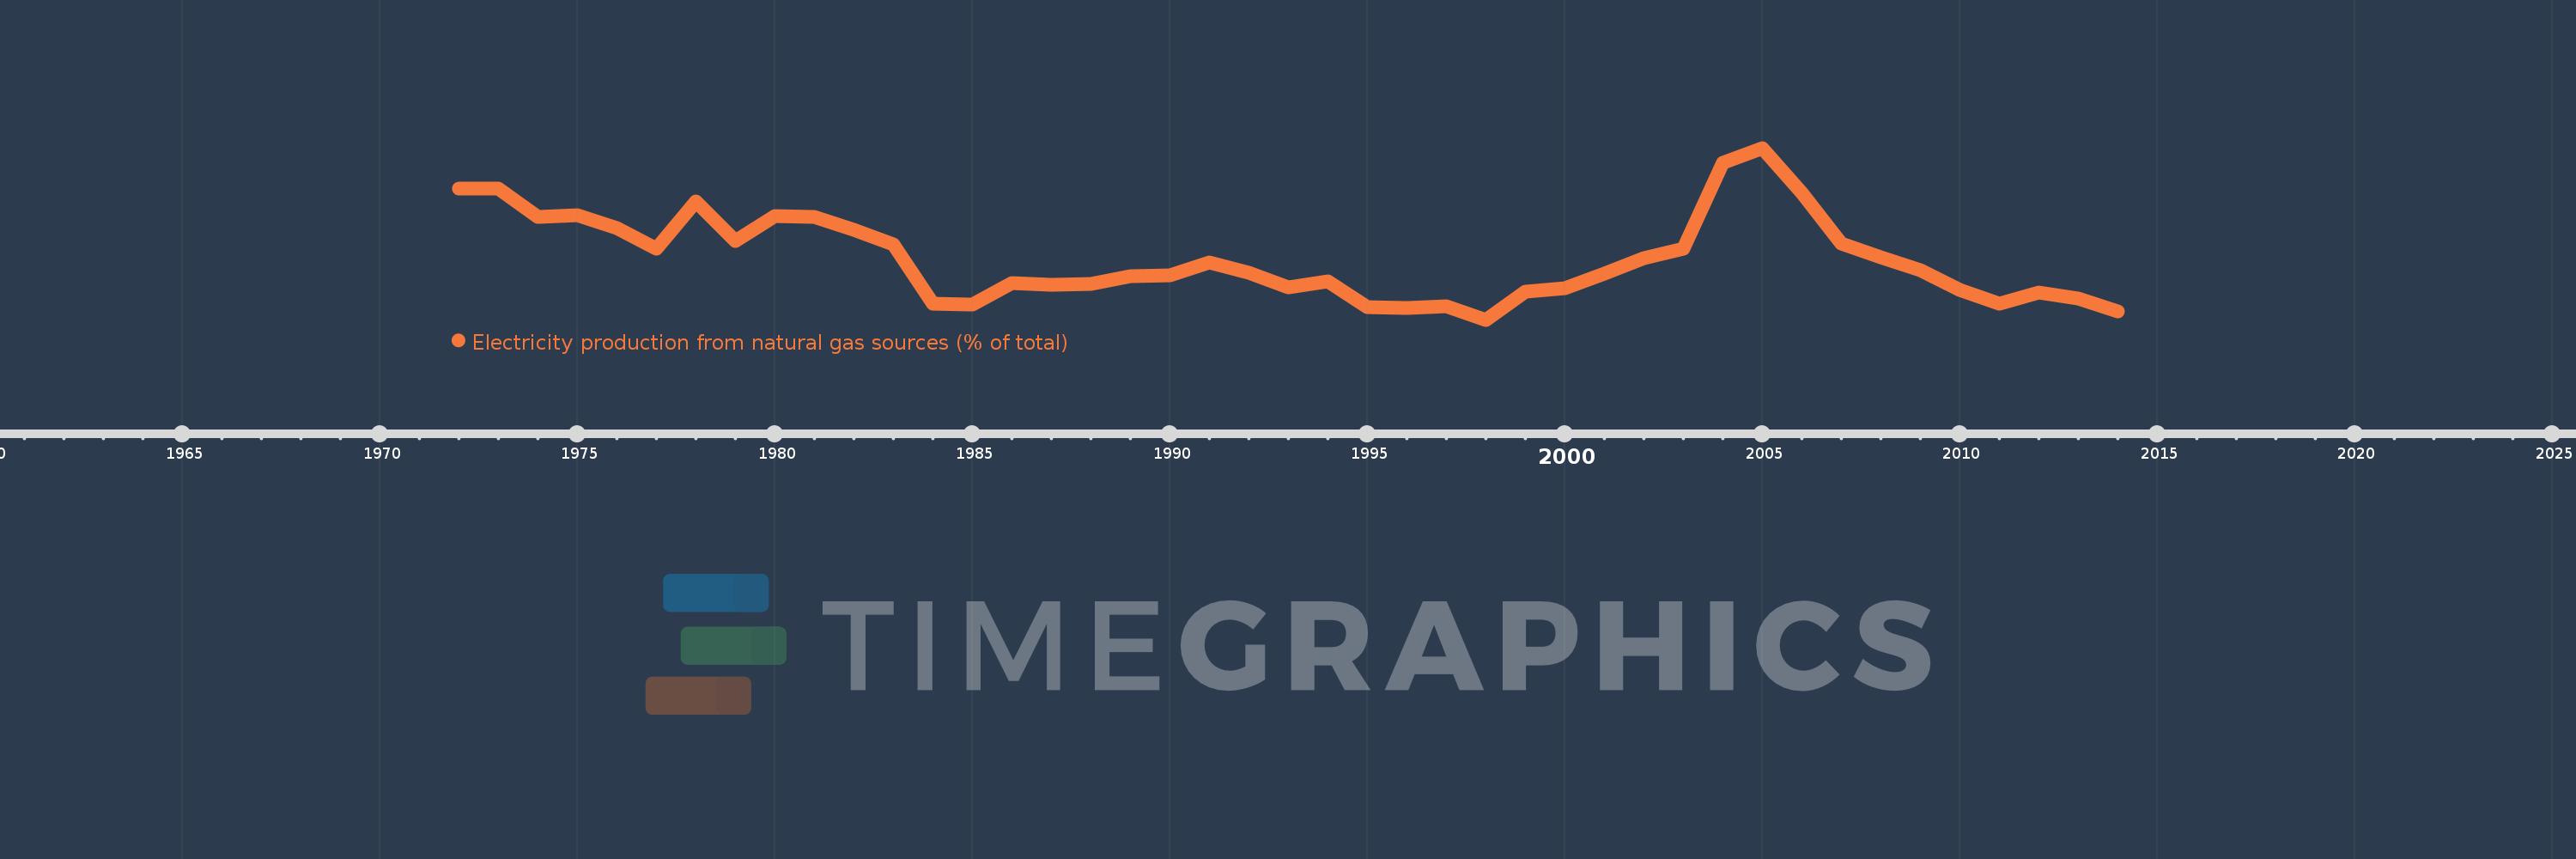
Electricity production from natural gas sources (% of total)
2014,2013,2012,2011,2010,2009,2008,2007,2006,2005,2004,2003,2002,2001,2000,1999,1998,1997,1996,1995,1994,1993,1992,1991,1990,1989,1988,1987,1986,1985,1984,1983,1982,1981,1980,1979,1978,1977,1976,1975,1974,1973,1972
Queste statistiche in altri paesi:
AlbaniaAlgeriaAngolaArab WorldArgentinaArmeniaAustraliaAustriaAzerbaijanBahrainBangladeshBelarusBelgiumBeninBoliviaBosnia and HerzegovinaBotswanaBrazilBrunei DarussalamBulgariaCambodiaCameroonCanadaCentral Europe and the BalticsChileChinaColombiaCongo, Dem. Rep.Congo, Rep.Costa RicaCote d'IvoireCroatiaCubaCuracaoCyprusCzech RepublicDenmarkDominican RepublicEarly-demographic dividendEast Asia & PacificEast Asia & Pacific (excluding high income)East Asia & Pacific (IDA & IBRD countries)EcuadorEgypt, Arab Rep.El SalvadorEritreaEstoniaEthiopiaEuro areaEurope & Central AsiaEurope & Central Asia (excluding high income)Europe & Central Asia (IDA & IBRD countries)European UnionFinlandFragile and conflict affected situationsFranceGabonGeorgiaGermanyGhanaGibraltarGreeceGuatemalaHaitiHeavily indebted poor countries (HIPC)High incomeHondurasHong Kong SAR, ChinaHungaryIBRD onlyIcelandIDA & IBRD totalIDA blendIDA onlyIDA totalIndiaIndonesiaIran, Islamic Rep.IraqIrelandIsraelItalyJamaicaJapanJordanKazakhstanKenyaKorea, Dem. People’s Rep.Korea, Rep.KosovoKuwaitKyrgyz RepublicLate-demographic dividendLatin America & Caribbean Latin America & Caribbean (excluding high income)Latin America & the Caribbean (IDA & IBRD countries)LatviaLeast developed countries: UN classificationLebanonLibyaLithuaniaLow & middle incomeLower middle incomeLuxembourgMacedonia, FYRMalaysiaMaltaMauritiusMexicoMiddle East & North AfricaMiddle East & North Africa (excluding high income)Middle East & North Africa (IDA & IBRD countries)Middle incomeMoldovaMongoliaMontenegroMoroccoMozambiqueMyanmarNamibiaNepalNetherlandsNew ZealandNicaraguaNigerNigeriaNorth AmericaNorwayOECD membersOmanOther small statesPakistanPanamaParaguayPeruPhilippinesPolandPortugalPost-demographic dividendPre-demographic dividendQatarRomaniaRussian FederationSaudi ArabiaSenegalSerbiaSingaporeSlovak RepublicSloveniaSmall statesSouth AfricaSouth AsiaSouth Asia (IDA & IBRD)South SudanSpainSri LankaSub-Saharan Africa Sub-Saharan Africa (excluding high income)Sub-Saharan Africa (IDA & IBRD countries)SudanSwedenSwitzerlandSyrian Arab RepublicTajikistanTanzaniaThailandTogoTrinidad and TobagoTunisiaTurkeyTurkmenistanUkraineUnited Arab EmiratesUnited KingdomUnited StatesUpper middle incomeUruguayUzbekistanVenezuela, RBVietnamWorldYemen, Rep.ZambiaZimbabwe Linea del tempo:
Questa scala temporale mostra un grafico dal 1972 anno al 2014 anno. Pakistan. I dati fino ad 1971 anno non disponibili. Il numero di osservazioni attuali secondo i date: 43.
La fonte (nome):
Indicatori dello sviluppo mondiale
La fonte (organizzazione):
IEA Statistics © OECD/IEA 2014 (http://www.iea.org/stats/index.asp), subject to https://www.iea.org/t&c/termsandconditions/
Categorie:
Energy & Mining, Climate Change, Infrastructure
sono stati aggiornati
23 apr 2017 anni
Indicatori delle variazioni dei valori per anni
Minima:
25.031
1 gen 1998 anni
Massimo:
50.768
1 gen 2005 anni
Alla data di osservazione
Valore
Variazione assoluta
La variazione rispetto al valore precedente
1 gen 1972 anni
44.665
+44.665
0.0%
1 gen 1973 anni
44.665
0.0
0.0%
1 gen 1974 anni
40.384
-4.28
-9.58%
1 gen 1975 anni
40.688
+0.304
0.75%
1 gen 1976 anni
38.708
-1.98
-4.87%
1 gen 1977 anni
35.678
-3.03
-7.83%
1 gen 1978 anni
42.732
+7.054
19.77%
1 gen 1979 anni
36.792
-5.94
-13.9%
1 gen 1980 anni
40.617
+3.825
10.4%
1 gen 1981 anni
40.484
-0.133
-0.33%
1 gen 1982 anni
38.526
-1.958
-4.84%
1 gen 1983 anni
36.313
-2.213
-5.74%
1 gen 1984 anni
27.415
-8.897
-24.5%
1 gen 1985 anni
27.312
-0.103
-0.38%
1 gen 1986 anni
30.579
+3.266
11.96%
1 gen 1987 anni
30.329
-0.249
-0.81%
1 gen 1988 anni
30.38
+0.051
0.17%
1 gen 1989 anni
31.549
+1.169
3.85%
1 gen 1990 anni
31.739
+0.19
0.6%
1 gen 1991 anni
33.629
+1.89
5.95%
1 gen 1992 anni
32.05
-1.579
-4.69%
1 gen 1993 anni
29.926
-2.124
-6.63%
1 gen 1994 anni
30.844
+0.917
3.07%
1 gen 1995 anni
26.877
-3.966
-12.86%
1 gen 1996 anni
26.829
-0.048
-0.18%
1 gen 1997 anni
27.048
+0.219
0.82%
1 gen 1998 anni
25.031
-2.017
-7.46%
1 gen 1999 anni
29.286
+4.255
17.0%
1 gen 2000 anni
29.754
+0.468
1.6%
1 gen 2001 anni
31.975
+2.221
7.47%
1 gen 2002 anni
34.316
+2.341
7.32%
1 gen 2003 anni
35.673
+1.357
3.96%
1 gen 2004 anni
48.513
+12.84
35.99%
1 gen 2005 anni
50.768
+2.255
4.65%
1 gen 2006 anni
44.095
-6.673
-13.14%
1 gen 2007 anni
36.463
-7.633
-17.31%
1 gen 2008 anni
34.416
-2.046
-5.61%
1 gen 2009 anni
32.394
-2.022
-5.88%
1 gen 2010 anni
29.446
-2.948
-9.1%
1 gen 2011 anni
27.419
-2.027
-6.88%
1 gen 2012 anni
29.078
+1.659
6.05%
1 gen 2013 anni
28.209
-0.869
-2.99%
1 gen 2014 anni
26.324
-1.885
-6.68%
Classificazione dei paesi secondo i statistiche attuali per anni


Commenti: