29
/it/
it
AIzaSyAYiBZKx7MnpbEhh9jyipgxe19OcubqV5w
April 1, 2024
48044
Middle East & North Africa
MEA
false
2
1
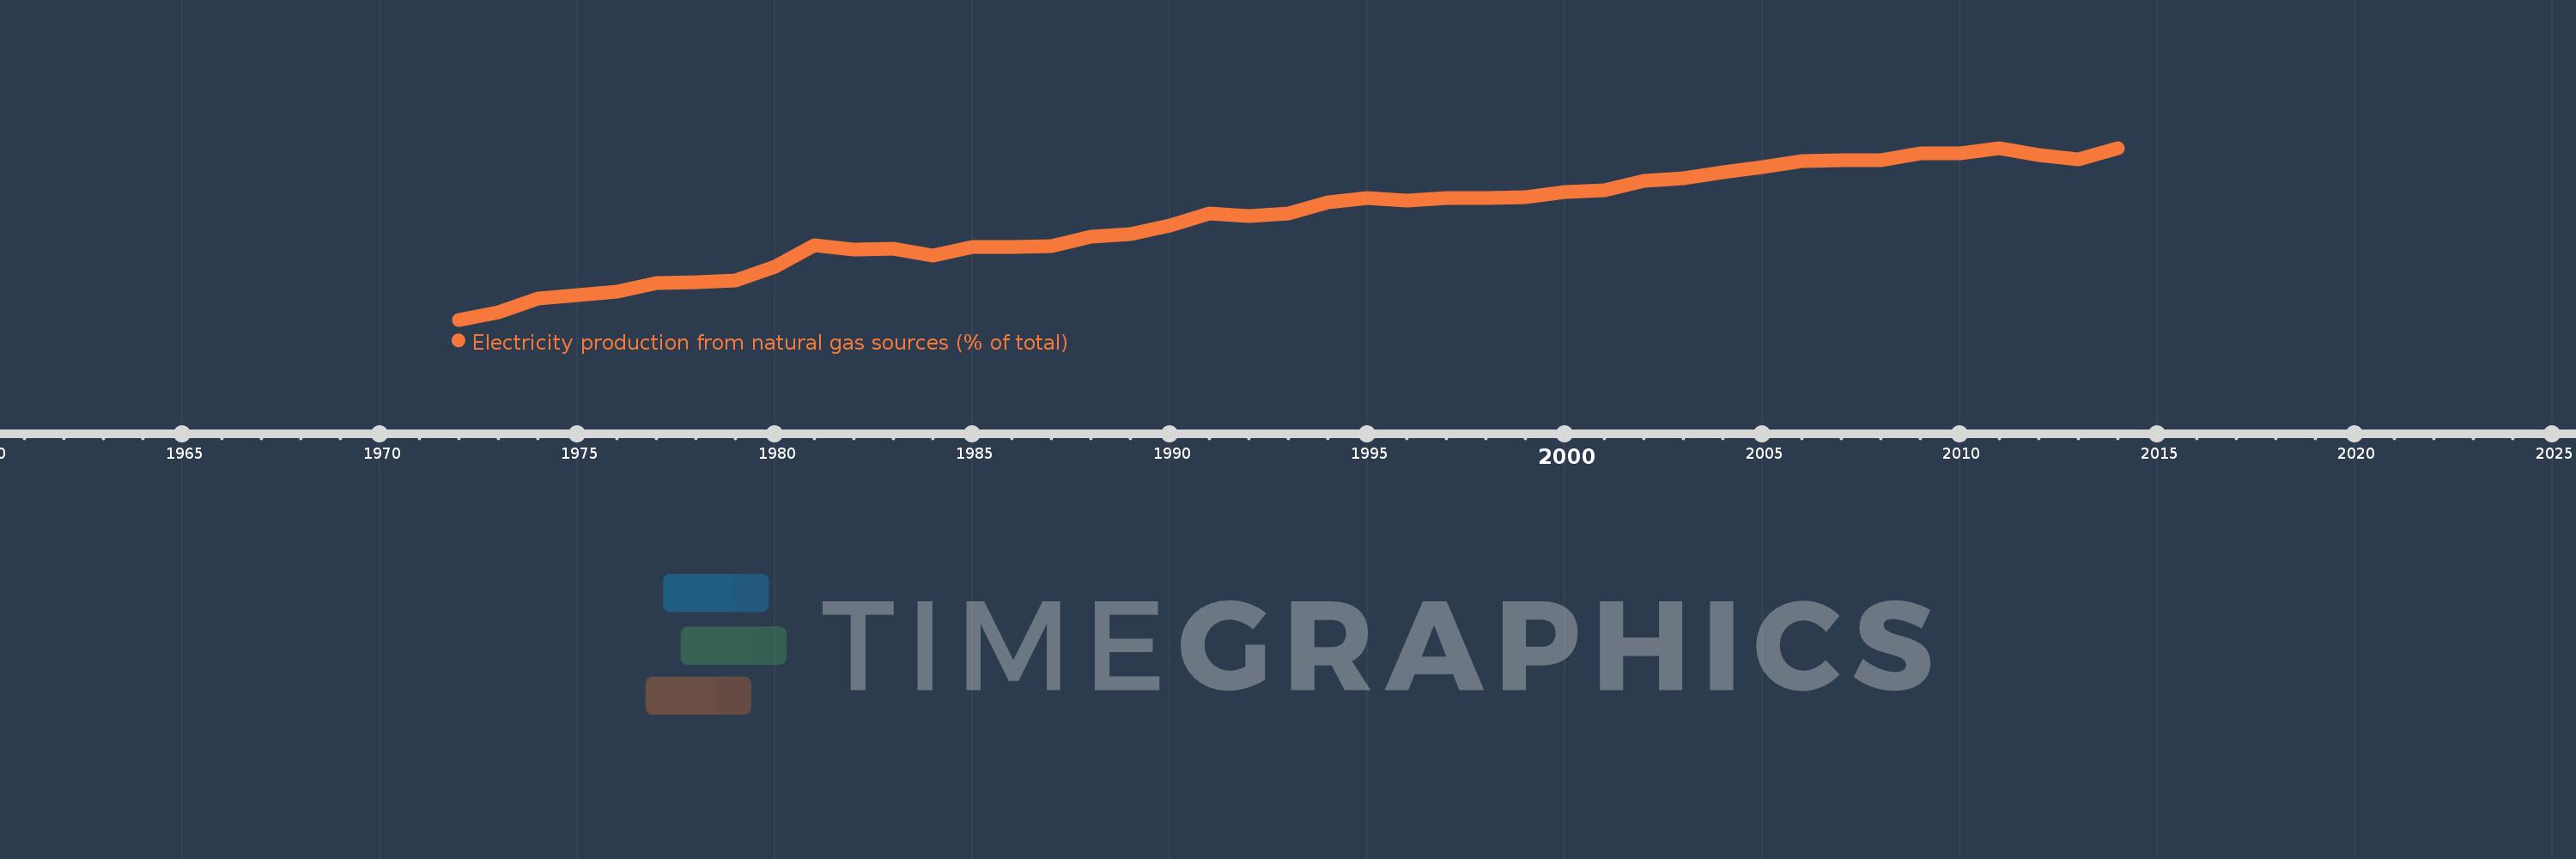
Electricity production from natural gas sources (% of total)
2014,2013,2012,2011,2010,2009,2008,2007,2006,2005,2004,2003,2002,2001,2000,1999,1998,1997,1996,1995,1994,1993,1992,1991,1990,1989,1988,1987,1986,1985,1984,1983,1982,1981,1980,1979,1978,1977,1976,1975,1974,1973,1972
Queste statistiche in altri paesi:
AlbaniaAlgeriaAngolaArab WorldArgentinaArmeniaAustraliaAustriaAzerbaijanBahrainBangladeshBelarusBelgiumBeninBoliviaBosnia and HerzegovinaBotswanaBrazilBrunei DarussalamBulgariaCambodiaCameroonCanadaCentral Europe and the BalticsChileChinaColombiaCongo, Dem. Rep.Congo, Rep.Costa RicaCote d'IvoireCroatiaCubaCuracaoCyprusCzech RepublicDenmarkDominican RepublicEarly-demographic dividendEast Asia & PacificEast Asia & Pacific (excluding high income)East Asia & Pacific (IDA & IBRD countries)EcuadorEgypt, Arab Rep.El SalvadorEritreaEstoniaEthiopiaEuro areaEurope & Central AsiaEurope & Central Asia (excluding high income)Europe & Central Asia (IDA & IBRD countries)European UnionFinlandFragile and conflict affected situationsFranceGabonGeorgiaGermanyGhanaGibraltarGreeceGuatemalaHaitiHeavily indebted poor countries (HIPC)High incomeHondurasHong Kong SAR, ChinaHungaryIBRD onlyIcelandIDA & IBRD totalIDA blendIDA onlyIDA totalIndiaIndonesiaIran, Islamic Rep.IraqIrelandIsraelItalyJamaicaJapanJordanKazakhstanKenyaKorea, Dem. People’s Rep.Korea, Rep.KosovoKuwaitKyrgyz RepublicLate-demographic dividendLatin America & Caribbean Latin America & Caribbean (excluding high income)Latin America & the Caribbean (IDA & IBRD countries)LatviaLeast developed countries: UN classificationLebanonLibyaLithuaniaLow & middle incomeLower middle incomeLuxembourgMacedonia, FYRMalaysiaMaltaMauritiusMexicoMiddle East & North AfricaMiddle East & North Africa (excluding high income)Middle East & North Africa (IDA & IBRD countries)Middle incomeMoldovaMongoliaMontenegroMoroccoMozambiqueMyanmarNamibiaNepalNetherlandsNew ZealandNicaraguaNigerNigeriaNorth AmericaNorwayOECD membersOmanOther small statesPakistanPanamaParaguayPeruPhilippinesPolandPortugalPost-demographic dividendPre-demographic dividendQatarRomaniaRussian FederationSaudi ArabiaSenegalSerbiaSingaporeSlovak RepublicSloveniaSmall statesSouth AfricaSouth AsiaSouth Asia (IDA & IBRD)South SudanSpainSri LankaSub-Saharan Africa Sub-Saharan Africa (excluding high income)Sub-Saharan Africa (IDA & IBRD countries)SudanSwedenSwitzerlandSyrian Arab RepublicTajikistanTanzaniaThailandTogoTrinidad and TobagoTunisiaTurkeyTurkmenistanUkraineUnited Arab EmiratesUnited KingdomUnited StatesUpper middle incomeUruguayUzbekistanVenezuela, RBVietnamWorldYemen, Rep.ZambiaZimbabwe Linea del tempo:
Questa scala temporale mostra un grafico dal 1972 anno al 2014 anno. Middle East & North Africa. I dati fino ad 1971 anno non disponibili. Il numero di osservazioni attuali secondo i date: 43.
La fonte (nome):
Indicatori dello sviluppo mondiale
La fonte (organizzazione):
IEA Statistics © OECD/IEA 2014 (http://www.iea.org/stats/index.asp), subject to https://www.iea.org/t&c/termsandconditions/
Categorie:
Energy & Mining, Climate Change, Infrastructure
sono stati aggiornati
23 apr 2017 anni
Indicatori delle variazioni dei valori per anni
Minima:
15.065
1 gen 1972 anni
Massimo:
64.83
1 gen 2011 anni
Alla data di osservazione
Valore
Variazione assoluta
La variazione rispetto al valore precedente
1 gen 1972 anni
15.065
+15.065
0.0%
1 gen 1973 anni
17.326
+2.262
15.01%
1 gen 1974 anni
21.094
+3.768
21.75%
1 gen 1975 anni
22.308
+1.213
5.75%
1 gen 1976 anni
23.101
+0.793
3.56%
1 gen 1977 anni
25.787
+2.686
11.63%
1 gen 1978 anni
25.9
+0.113
0.44%
1 gen 1979 anni
26.465
+0.565
2.18%
1 gen 1980 anni
30.437
+3.971
15.01%
1 gen 1981 anni
36.583
+6.147
20.19%
1 gen 1982 anni
35.304
-1.279
-3.5%
1 gen 1983 anni
35.524
+0.22
0.62%
1 gen 1984 anni
33.747
-1.777
-5.0%
1 gen 1985 anni
36.2
+2.453
7.27%
1 gen 1986 anni
36.247
+0.046
0.13%
1 gen 1987 anni
36.362
+0.115
0.32%
1 gen 1988 anni
39.054
+2.692
7.4%
1 gen 1989 anni
39.97
+0.916
2.34%
1 gen 1990 anni
42.297
+2.327
5.82%
1 gen 1991 anni
45.879
+3.582
8.47%
1 gen 1992 anni
45.207
-0.671
-1.46%
1 gen 1993 anni
45.945
+0.737
1.63%
1 gen 1994 anni
49.063
+3.118
6.79%
1 gen 1995 anni
50.373
+1.31
2.67%
1 gen 1996 anni
49.698
-0.675
-1.34%
1 gen 1997 anni
50.211
+0.513
1.03%
1 gen 1998 anni
50.406
+0.195
0.39%
1 gen 1999 anni
50.599
+0.193
0.38%
1 gen 2000 anni
52.067
+1.468
2.9%
1 gen 2001 anni
52.543
+0.477
0.92%
1 gen 2002 anni
55.388
+2.844
5.41%
1 gen 2003 anni
56.151
+0.763
1.38%
1 gen 2004 anni
57.785
+1.634
2.91%
1 gen 2005 anni
59.265
+1.481
2.56%
1 gen 2006 anni
60.965
+1.7
2.87%
1 gen 2007 anni
61.178
+0.214
0.35%
1 gen 2008 anni
61.268
+0.09
0.15%
1 gen 2009 anni
63.307
+2.039
3.33%
1 gen 2010 anni
63.337
+0.03
0.05%
1 gen 2011 anni
64.83
+1.493
2.36%
1 gen 2012 anni
62.852
-1.978
-3.05%
1 gen 2013 anni
61.579
-1.273
-2.03%
1 gen 2014 anni
64.738
+3.159
5.13%
Classificazione dei paesi secondo i statistiche attuali per anni


Commenti: