29
/it/
it
AIzaSyAYiBZKx7MnpbEhh9jyipgxe19OcubqV5w
April 1, 2024
115706
Cuba
CUB
true
2
1
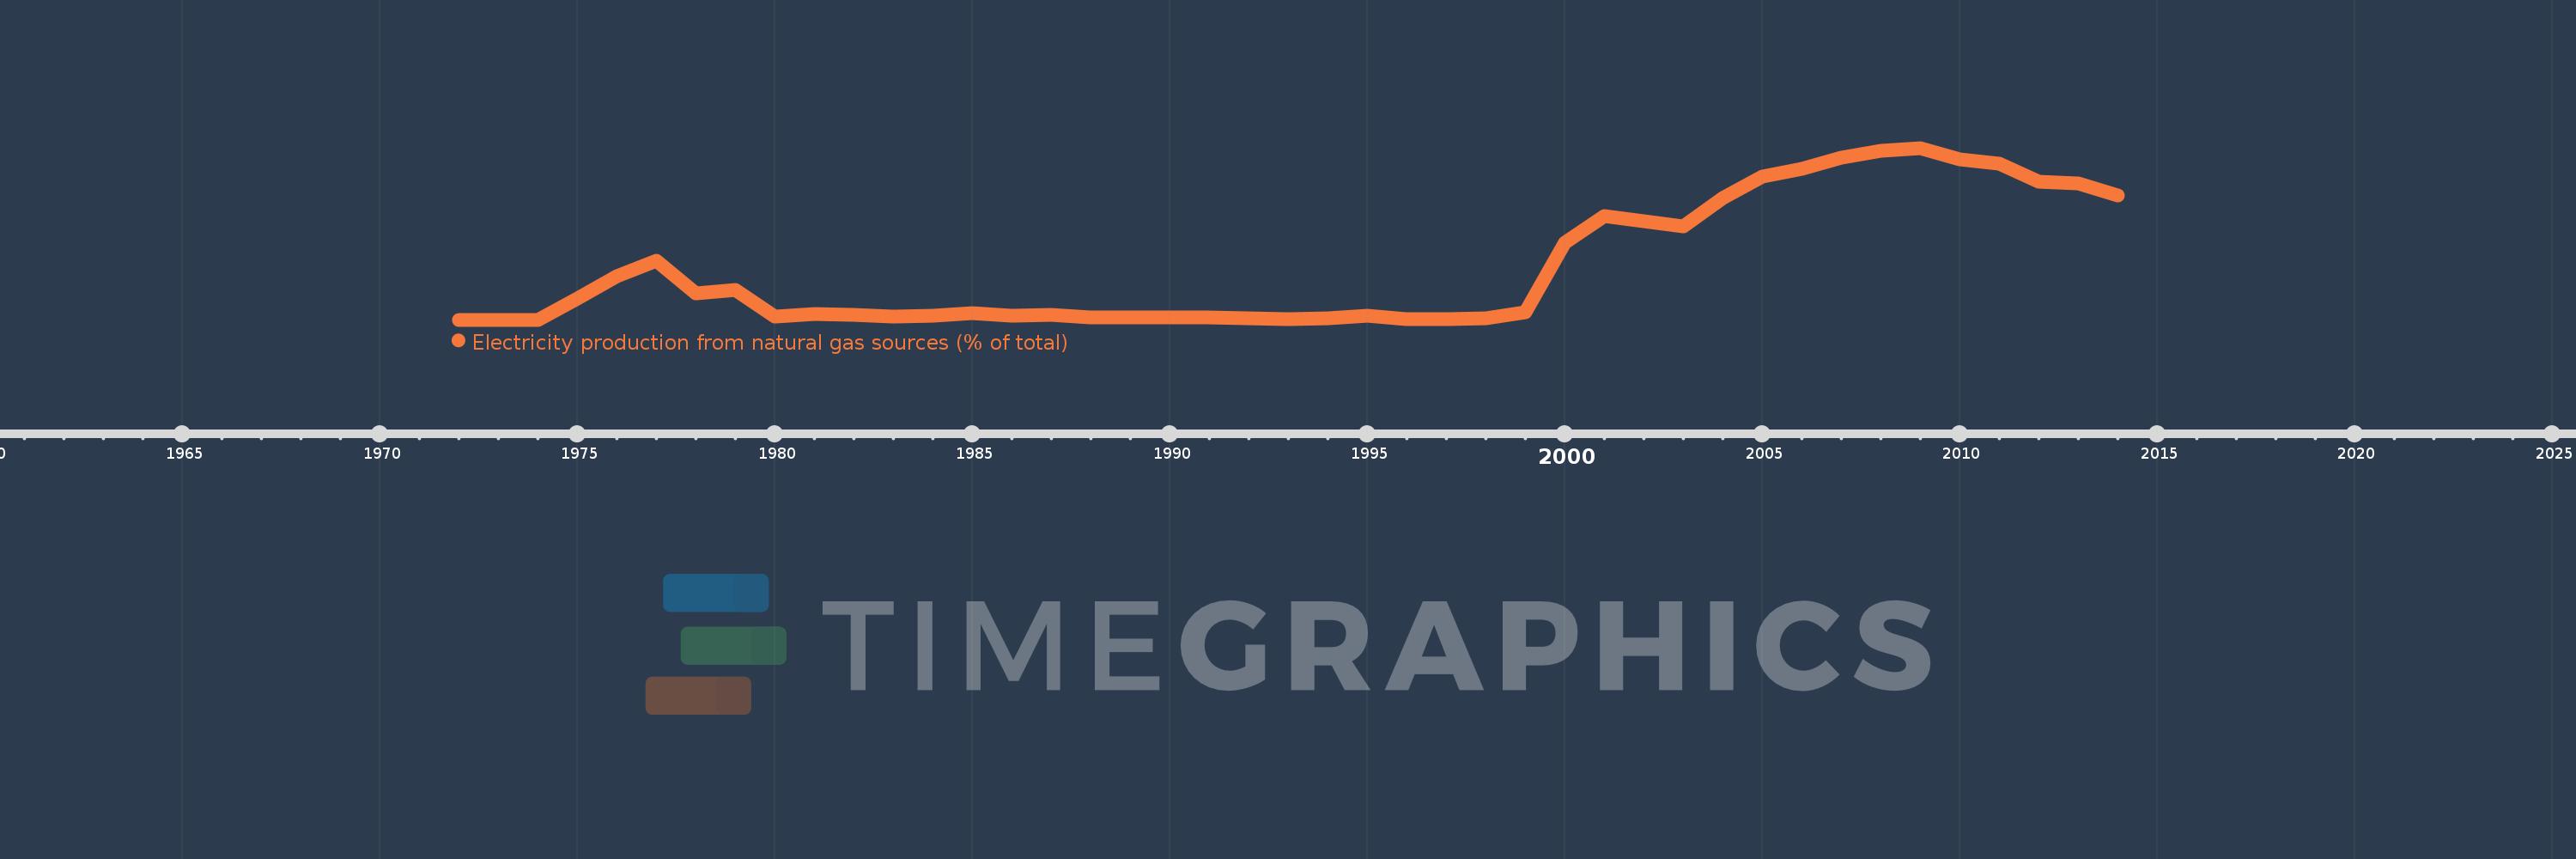
Electricity production from natural gas sources (% of total)
2014,2013,2012,2011,2010,2009,2008,2007,2006,2005,2004,2003,2002,2001,2000,1999,1998,1997,1996,1995,1994,1993,1992,1991,1990,1989,1988,1987,1986,1985,1984,1983,1982,1981,1980,1979,1978,1977,1976,1975,1974,1973,1972
Queste statistiche in altri paesi:
AlbaniaAlgeriaAngolaArab WorldArgentinaArmeniaAustraliaAustriaAzerbaijanBahrainBangladeshBelarusBelgiumBeninBoliviaBosnia and HerzegovinaBotswanaBrazilBrunei DarussalamBulgariaCambodiaCameroonCanadaCentral Europe and the BalticsChileChinaColombiaCongo, Dem. Rep.Congo, Rep.Costa RicaCote d'IvoireCroatiaCubaCuracaoCyprusCzech RepublicDenmarkDominican RepublicEarly-demographic dividendEast Asia & PacificEast Asia & Pacific (excluding high income)East Asia & Pacific (IDA & IBRD countries)EcuadorEgypt, Arab Rep.El SalvadorEritreaEstoniaEthiopiaEuro areaEurope & Central AsiaEurope & Central Asia (excluding high income)Europe & Central Asia (IDA & IBRD countries)European UnionFinlandFragile and conflict affected situationsFranceGabonGeorgiaGermanyGhanaGibraltarGreeceGuatemalaHaitiHeavily indebted poor countries (HIPC)High incomeHondurasHong Kong SAR, ChinaHungaryIBRD onlyIcelandIDA & IBRD totalIDA blendIDA onlyIDA totalIndiaIndonesiaIran, Islamic Rep.IraqIrelandIsraelItalyJamaicaJapanJordanKazakhstanKenyaKorea, Dem. People’s Rep.Korea, Rep.KosovoKuwaitKyrgyz RepublicLate-demographic dividendLatin America & Caribbean Latin America & Caribbean (excluding high income)Latin America & the Caribbean (IDA & IBRD countries)LatviaLeast developed countries: UN classificationLebanonLibyaLithuaniaLow & middle incomeLower middle incomeLuxembourgMacedonia, FYRMalaysiaMaltaMauritiusMexicoMiddle East & North AfricaMiddle East & North Africa (excluding high income)Middle East & North Africa (IDA & IBRD countries)Middle incomeMoldovaMongoliaMontenegroMoroccoMozambiqueMyanmarNamibiaNepalNetherlandsNew ZealandNicaraguaNigerNigeriaNorth AmericaNorwayOECD membersOmanOther small statesPakistanPanamaParaguayPeruPhilippinesPolandPortugalPost-demographic dividendPre-demographic dividendQatarRomaniaRussian FederationSaudi ArabiaSenegalSerbiaSingaporeSlovak RepublicSloveniaSmall statesSouth AfricaSouth AsiaSouth Asia (IDA & IBRD)South SudanSpainSri LankaSub-Saharan Africa Sub-Saharan Africa (excluding high income)Sub-Saharan Africa (IDA & IBRD countries)SudanSwedenSwitzerlandSyrian Arab RepublicTajikistanTanzaniaThailandTogoTrinidad and TobagoTunisiaTurkeyTurkmenistanUkraineUnited Arab EmiratesUnited KingdomUnited StatesUpper middle incomeUruguayUzbekistanVenezuela, RBVietnamWorldYemen, Rep.ZambiaZimbabwe Linea del tempo:
Questa scala temporale mostra un grafico dal 1972 anno al 2014 anno. Cuba. I dati fino ad 1971 anno non disponibili. Il numero di osservazioni attuali secondo i date: 43.
La fonte (nome):
Indicatori dello sviluppo mondiale
La fonte (organizzazione):
IEA Statistics © OECD/IEA 2014 (http://www.iea.org/stats/index.asp), subject to https://www.iea.org/t&c/termsandconditions/
Categorie:
Energy & Mining, Climate Change, Infrastructure
sono stati aggiornati
23 apr 2017 anni
Indicatori delle variazioni dei valori per anni
Minima:
0.0
1 gen 1972 anni
Massimo:
14.35
1 gen 2009 anni
Alla data di osservazione
Valore
Variazione assoluta
La variazione rispetto al valore precedente
1 gen 1972 anni
0.0
0.0
0.0%
1 gen 1975 anni
1.761
+1.761
%
1 gen 1976 anni
3.628
+1.867
106.0%
1 gen 1977 anni
4.948
+1.32
36.39%
1 gen 1978 anni
2.232
-2.716
-54.88%
1 gen 1979 anni
2.511
+0.278
12.47%
1 gen 1980 anni
0.255
-2.255
-89.83%
1 gen 1981 anni
0.471
+0.215
84.33%
1 gen 1982 anni
0.426
-0.045
-9.56%
1 gen 1983 anni
0.244
-0.182
-42.69%
1 gen 1984 anni
0.338
+0.094
38.44%
1 gen 1985 anni
0.529
+0.191
56.65%
1 gen 1986 anni
0.32
-0.209
-39.55%
1 gen 1987 anni
0.44
+0.12
37.69%
1 gen 1988 anni
0.206
-0.234
-53.21%
1 gen 1989 anni
0.199
-0.007
-3.19%
1 gen 1990 anni
0.164
-0.035
-17.74%
1 gen 1991 anni
0.16
-0.004
-2.63%
1 gen 1992 anni
0.106
-0.054
-33.84%
1 gen 1993 anni
0.043
-0.062
-59.0%
1 gen 1994 anni
0.127
+0.084
193.64%
1 gen 1995 anni
0.343
+0.215
169.29%
1 gen 1996 anni
0.064
-0.278
-81.26%
1 gen 1997 anni
0.076
+0.011
17.66%
1 gen 1998 anni
0.092
+0.016
21.64%
1 gen 1999 anni
0.65
+0.558
607.59%
1 gen 2000 anni
6.438
+5.788
890.06%
1 gen 2001 anni
8.695
+2.257
35.05%
1 gen 2002 anni
8.223
-0.472
-5.43%
1 gen 2003 anni
7.79
-0.432
-5.26%
1 gen 2004 anni
10.19
+2.399
30.8%
1 gen 2005 anni
11.968
+1.778
17.45%
1 gen 2006 anni
12.625
+0.658
5.5%
1 gen 2007 anni
13.559
+0.933
7.39%
1 gen 2008 anni
14.145
+0.587
4.33%
1 gen 2009 anni
14.35
+0.205
1.45%
1 gen 2010 anni
13.426
-0.924
-6.44%
1 gen 2011 anni
13.042
-0.384
-2.86%
1 gen 2012 anni
11.565
-1.477
-11.33%
1 gen 2013 anni
11.352
-0.213
-1.84%
1 gen 2014 anni
10.381
-0.971
-8.55%
Classificazione dei paesi secondo i statistiche attuali per anni


Commenti: