29
/it/
it
AIzaSyAYiBZKx7MnpbEhh9jyipgxe19OcubqV5w
April 1, 2024
54693
Post-demographic dividend
PST
false
2
1
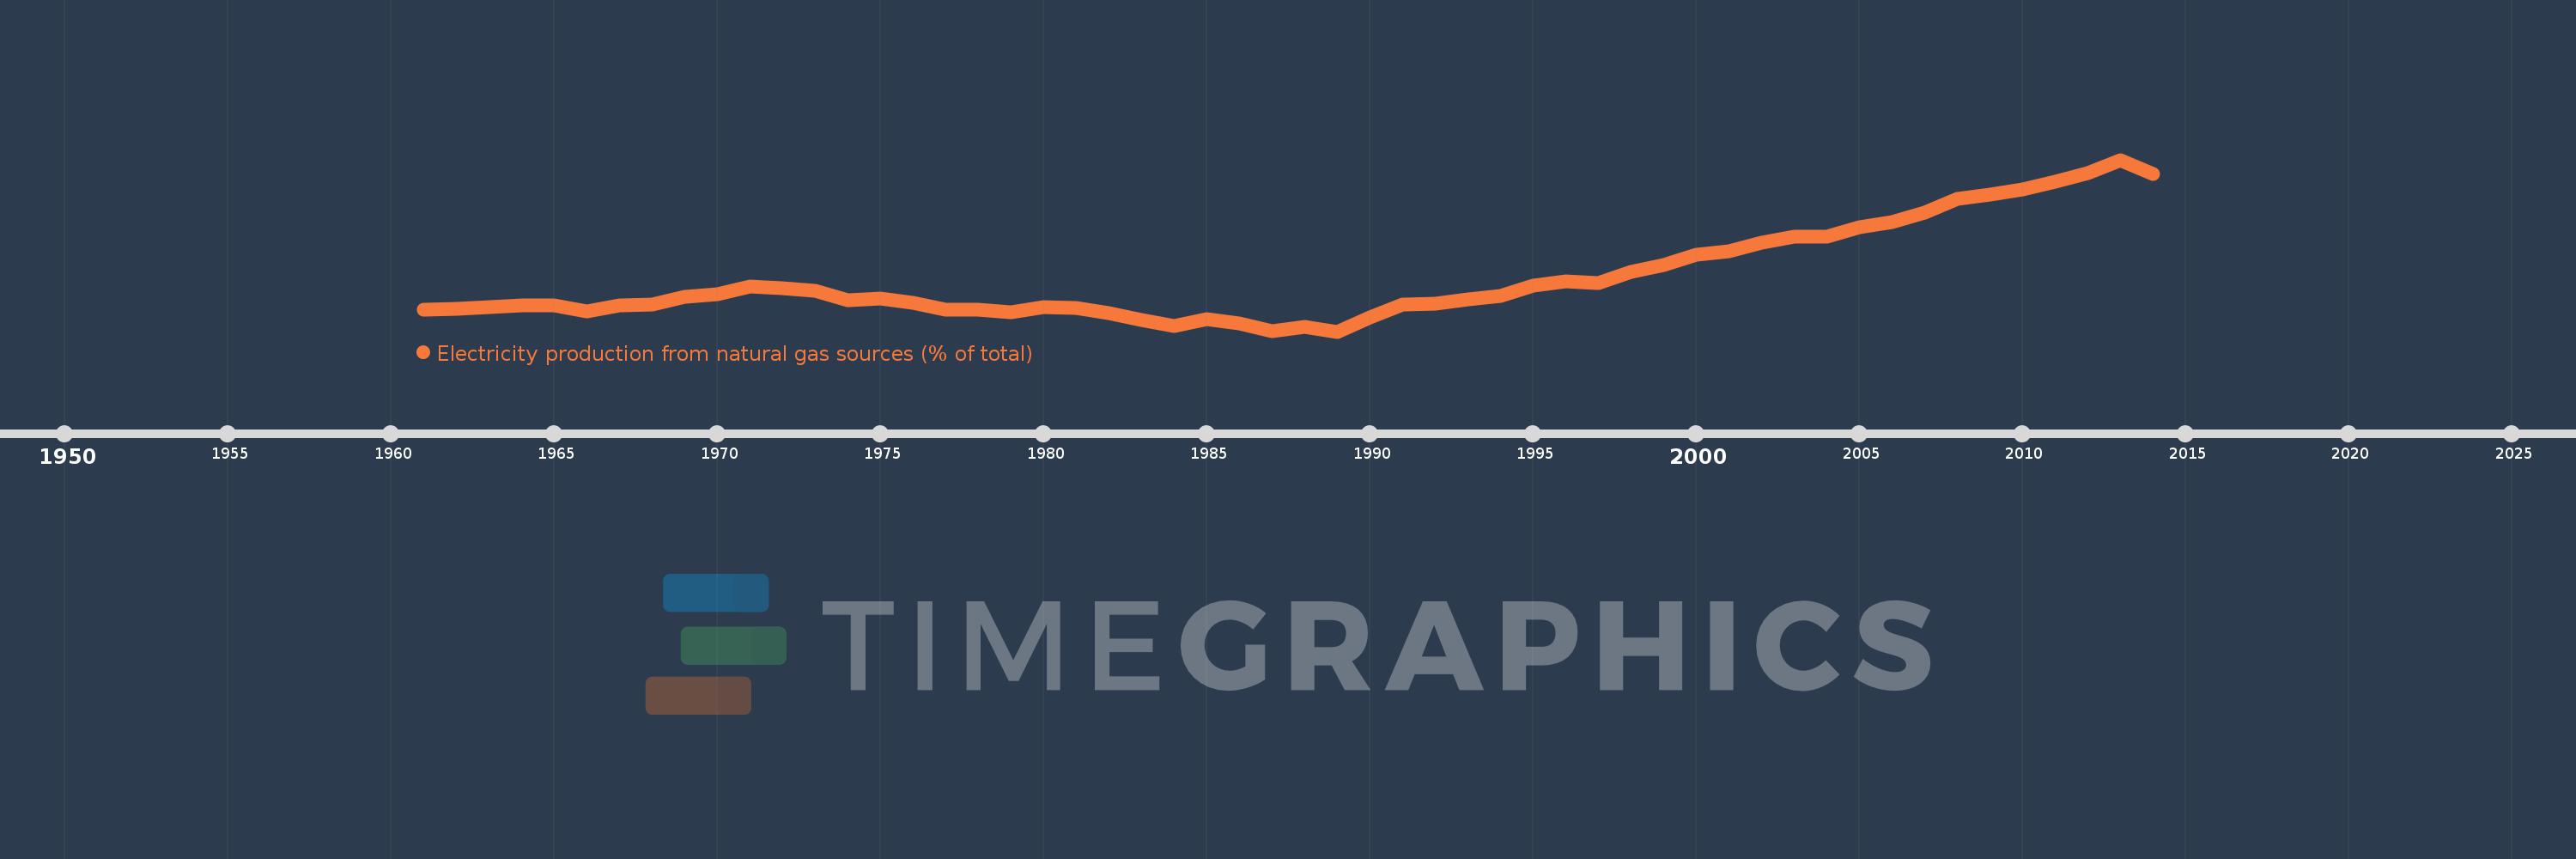
Electricity production from natural gas sources (% of total)
2014,2013,2012,2011,2010,2009,2008,2007,2006,2005,2004,2003,2002,2001,2000,1999,1998,1997,1996,1995,1994,1993,1992,1991,1990,1989,1988,1987,1986,1985,1984,1983,1982,1981,1980,1979,1978,1977,1976,1975,1974,1973,1972,1971,1970,1969,1968,1967,1966,1965,1964,1963,1962,1961
Queste statistiche in altri paesi:
AlbaniaAlgeriaAngolaArab WorldArgentinaArmeniaAustraliaAustriaAzerbaijanBahrainBangladeshBelarusBelgiumBeninBoliviaBosnia and HerzegovinaBotswanaBrazilBrunei DarussalamBulgariaCambodiaCameroonCanadaCentral Europe and the BalticsChileChinaColombiaCongo, Dem. Rep.Congo, Rep.Costa RicaCote d'IvoireCroatiaCubaCuracaoCyprusCzech RepublicDenmarkDominican RepublicEarly-demographic dividendEast Asia & PacificEast Asia & Pacific (excluding high income)East Asia & Pacific (IDA & IBRD countries)EcuadorEgypt, Arab Rep.El SalvadorEritreaEstoniaEthiopiaEuro areaEurope & Central AsiaEurope & Central Asia (excluding high income)Europe & Central Asia (IDA & IBRD countries)European UnionFinlandFragile and conflict affected situationsFranceGabonGeorgiaGermanyGhanaGibraltarGreeceGuatemalaHaitiHeavily indebted poor countries (HIPC)High incomeHondurasHong Kong SAR, ChinaHungaryIBRD onlyIcelandIDA & IBRD totalIDA blendIDA onlyIDA totalIndiaIndonesiaIran, Islamic Rep.IraqIrelandIsraelItalyJamaicaJapanJordanKazakhstanKenyaKorea, Dem. People’s Rep.Korea, Rep.KosovoKuwaitKyrgyz RepublicLate-demographic dividendLatin America & Caribbean Latin America & Caribbean (excluding high income)Latin America & the Caribbean (IDA & IBRD countries)LatviaLeast developed countries: UN classificationLebanonLibyaLithuaniaLow & middle incomeLower middle incomeLuxembourgMacedonia, FYRMalaysiaMaltaMauritiusMexicoMiddle East & North AfricaMiddle East & North Africa (excluding high income)Middle East & North Africa (IDA & IBRD countries)Middle incomeMoldovaMongoliaMontenegroMoroccoMozambiqueMyanmarNamibiaNepalNetherlandsNew ZealandNicaraguaNigerNigeriaNorth AmericaNorwayOECD membersOmanOther small statesPakistanPanamaParaguayPeruPhilippinesPolandPortugalPost-demographic dividendPre-demographic dividendQatarRomaniaRussian FederationSaudi ArabiaSenegalSerbiaSingaporeSlovak RepublicSloveniaSmall statesSouth AfricaSouth AsiaSouth Asia (IDA & IBRD)South SudanSpainSri LankaSub-Saharan Africa Sub-Saharan Africa (excluding high income)Sub-Saharan Africa (IDA & IBRD countries)SudanSwedenSwitzerlandSyrian Arab RepublicTajikistanTanzaniaThailandTogoTrinidad and TobagoTunisiaTurkeyTurkmenistanUkraineUnited Arab EmiratesUnited KingdomUnited StatesUpper middle incomeUruguayUzbekistanVenezuela, RBVietnamWorldYemen, Rep.ZambiaZimbabwe Linea del tempo:
Questa scala temporale mostra un grafico dal 1961 anno al 2014 anno. Post-demographic dividend. I dati fino ad 1960 anno non disponibili. Il numero di osservazioni attuali secondo i date: 54.
La fonte (nome):
Indicatori dello sviluppo mondiale
La fonte (organizzazione):
IEA Statistics © OECD/IEA 2014 (http://www.iea.org/stats/index.asp), subject to https://www.iea.org/t&c/termsandconditions/
Categorie:
Energy & Mining, Climate Change, Infrastructure
sono stati aggiornati
23 apr 2017 anni
Indicatori delle variazioni dei valori per anni
Minima:
8.2
1 gen 1989 anni
Massimo:
24.793
1 gen 2013 anni
Alla data di osservazione
Valore
Variazione assoluta
La variazione rispetto al valore precedente
1 gen 1961 anni
10.288
+10.288
0.0%
1 gen 1962 anni
10.417
+0.13
1.26%
1 gen 1963 anni
10.564
+0.146
1.4%
1 gen 1964 anni
10.699
+0.135
1.28%
1 gen 1965 anni
10.717
+0.018
0.17%
1 gen 1966 anni
10.156
-0.561
-5.23%
1 gen 1967 anni
10.761
+0.605
5.95%
1 gen 1968 anni
10.774
+0.013
0.12%
1 gen 1969 anni
11.548
+0.774
7.18%
1 gen 1970 anni
11.807
+0.259
2.24%
1 gen 1971 anni
12.515
+0.708
5.99%
1 gen 1972 anni
12.416
-0.099
-0.79%
1 gen 1973 anni
12.126
-0.29
-2.34%
1 gen 1974 anni
11.201
-0.925
-7.63%
1 gen 1975 anni
11.366
+0.166
1.48%
1 gen 1976 anni
10.985
-0.382
-3.36%
1 gen 1977 anni
10.331
-0.654
-5.95%
1 gen 1978 anni
10.28
-0.051
-0.49%
1 gen 1979 anni
10.081
-0.2
-1.94%
1 gen 1980 anni
10.552
+0.471
4.67%
1 gen 1981 anni
10.463
-0.089
-0.84%
1 gen 1982 anni
9.978
-0.485
-4.63%
1 gen 1983 anni
9.295
-0.683
-6.85%
1 gen 1984 anni
8.704
-0.591
-6.36%
1 gen 1985 anni
9.374
+0.67
7.7%
1 gen 1986 anni
8.948
-0.426
-4.54%
1 gen 1987 anni
8.238
-0.71
-7.93%
1 gen 1988 anni
8.647
+0.409
4.96%
1 gen 1989 anni
8.2
-0.447
-5.17%
1 gen 1990 anni
9.545
+1.345
16.4%
1 gen 1991 anni
10.777
+1.231
12.9%
1 gen 1992 anni
10.874
+0.097
0.9%
1 gen 1993 anni
11.312
+0.438
4.03%
1 gen 1994 anni
11.668
+0.355
3.14%
1 gen 1995 anni
12.598
+0.93
7.97%
1 gen 1996 anni
13.038
+0.441
3.5%
1 gen 1997 anni
12.892
-0.146
-1.12%
1 gen 1998 anni
13.947
+1.055
8.18%
1 gen 1999 anni
14.614
+0.667
4.78%
1 gen 2000 anni
15.637
+1.023
7.0%
1 gen 2001 anni
15.955
+0.318
2.03%
1 gen 2002 anni
16.751
+0.796
4.99%
1 gen 2003 anni
17.401
+0.651
3.88%
1 gen 2004 anni
17.381
-0.021
-0.12%
1 gen 2005 anni
18.28
+0.899
5.17%
1 gen 2006 anni
18.796
+0.516
2.82%
1 gen 2007 anni
19.659
+0.864
4.6%
1 gen 2008 anni
21.013
+1.353
6.88%
1 gen 2009 anni
21.405
+0.392
1.87%
1 gen 2010 anni
21.932
+0.528
2.47%
1 gen 2011 anni
22.665
+0.733
3.34%
1 gen 2012 anni
23.489
+0.824
3.63%
1 gen 2013 anni
24.793
+1.304
5.55%
1 gen 2014 anni
23.436
-1.356
-5.47%
Classificazione dei paesi secondo i statistiche attuali per anni


Commenti: